Fig. 5.
Download original image
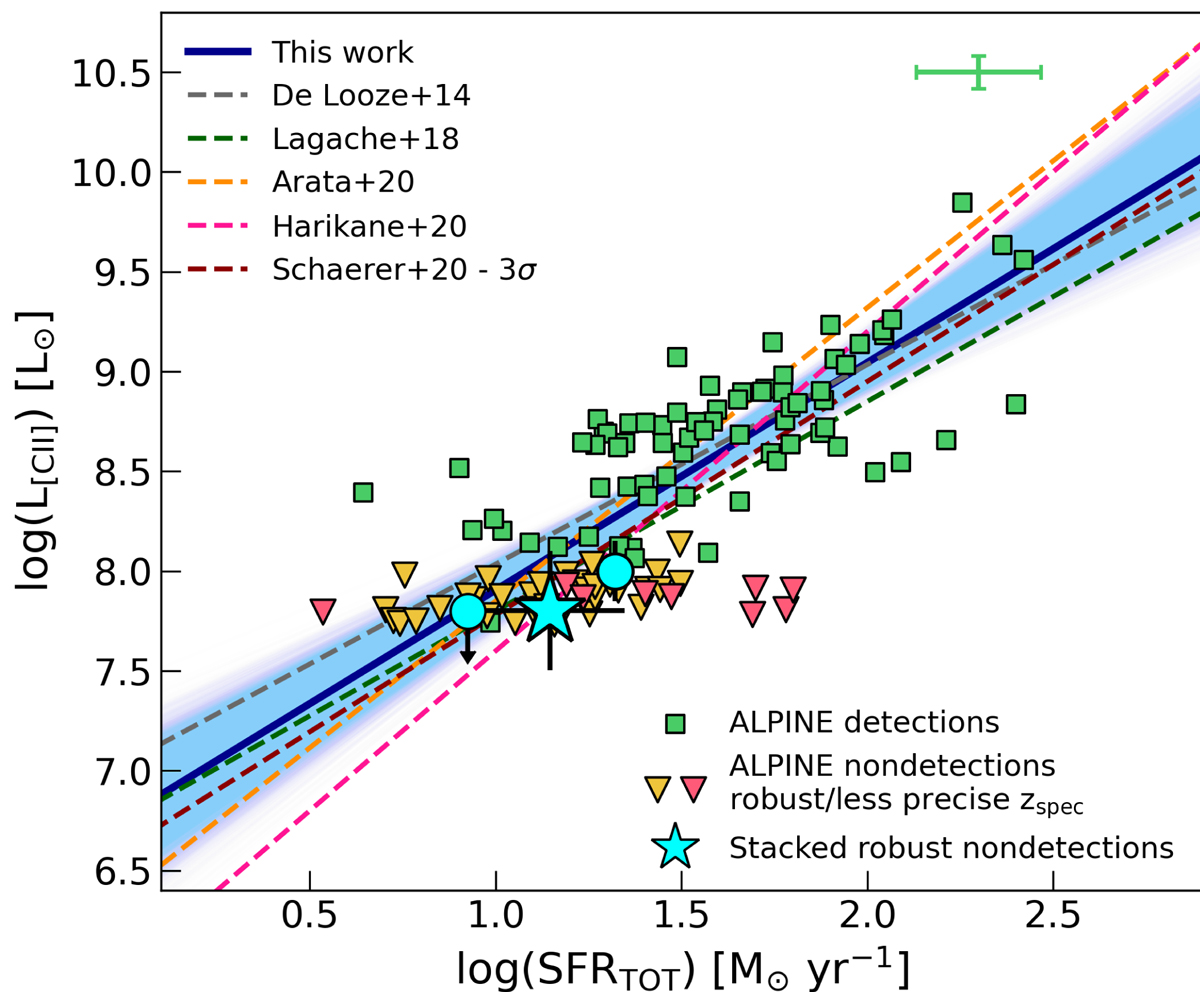
[CII] luminosity as a function of total SFR (UV+FIR; see text) for the ALPINE detections (green squares) and nondetections (as 3σ upper limits; yellow triangles). The red markers represent the [CII]-undetected galaxies with less precise zspec (see Sect. 2). The green errobars in the upper right corner show the average uncertainties of [CII] detections on both L[CII] and SFR. The cyan big star shows the result of this work for the stacked nondetections, with the error on L[CII] computed as described in Sect. 3. The cyan circles are the [CII] upper limit and detection found in the low- and high-SFR bins introduced in the text, respectively. We also report different L[CII]-SFR relations from the literature: the local relation by De Looze et al. (2014) (dashed gray line), the predicted relation by the models of Lagache et al. (2018) at z ∼ 5 (dashed green line), the predicted relation by Arata et al. (2020) for galaxies at z > 6 (dashed yellow line), the fitted relation by Harikane et al. (2020) on z > 6 galaxies (dashed pink line), the latest results obtained by Schaerer et al. (2020) at z ∼ 5 with ALPINE considering nondetections as 3σ upper limits (dashed red line). Finally, the solid blue line and shaded area report our best-fit and uncertainties to the [CII] detections + stacked robust nondetections.
Current usage metrics show cumulative count of Article Views (full-text article views including HTML views, PDF and ePub downloads, according to the available data) and Abstracts Views on Vision4Press platform.
Data correspond to usage on the plateform after 2015. The current usage metrics is available 48-96 hours after online publication and is updated daily on week days.
Initial download of the metrics may take a while.