Fig. 4.
Download original image
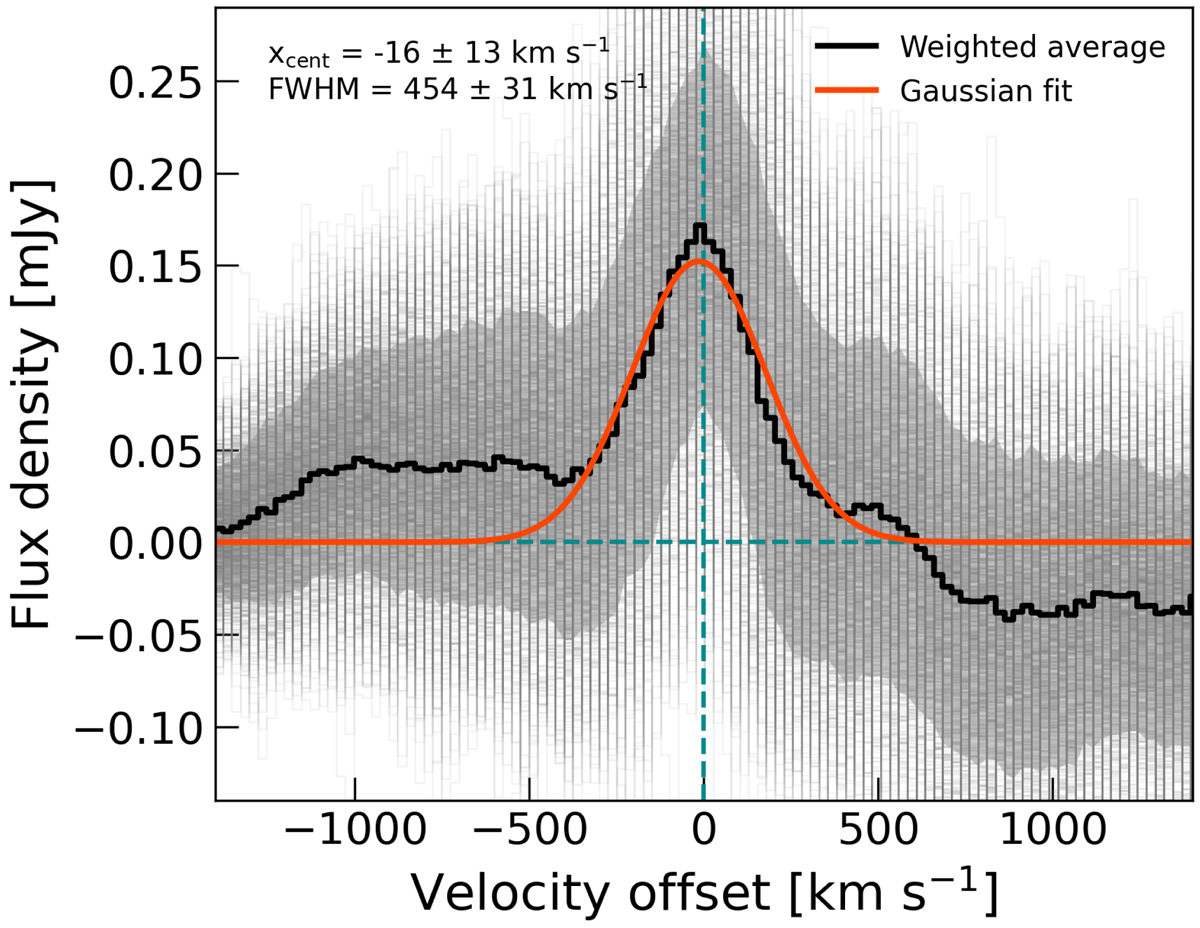
Average spectrum of the ALPINE [CII] nondetections weighted for the S/N of the individual stacked spectra with FWHM ≤ 400 km s−1 (solid black line). The thin lines represent the individual realizations after taking into account the observed shift between the [CII] and Lyα lines (Cassata et al. 2020). The solid red line represents the Gaussian fit on the average line profile. The shaded area shows the uncertainty associated with the average line profile as taken from the 16th and 84th percentiles of the 1000 spectra distribution. The dashed dark cyan lines mark the zero flux and velocity offset levels. The centroid and FWHM computed from the Gaussian fit on the average line profile are shown on the top left corner.
Current usage metrics show cumulative count of Article Views (full-text article views including HTML views, PDF and ePub downloads, according to the available data) and Abstracts Views on Vision4Press platform.
Data correspond to usage on the plateform after 2015. The current usage metrics is available 48-96 hours after online publication and is updated daily on week days.
Initial download of the metrics may take a while.