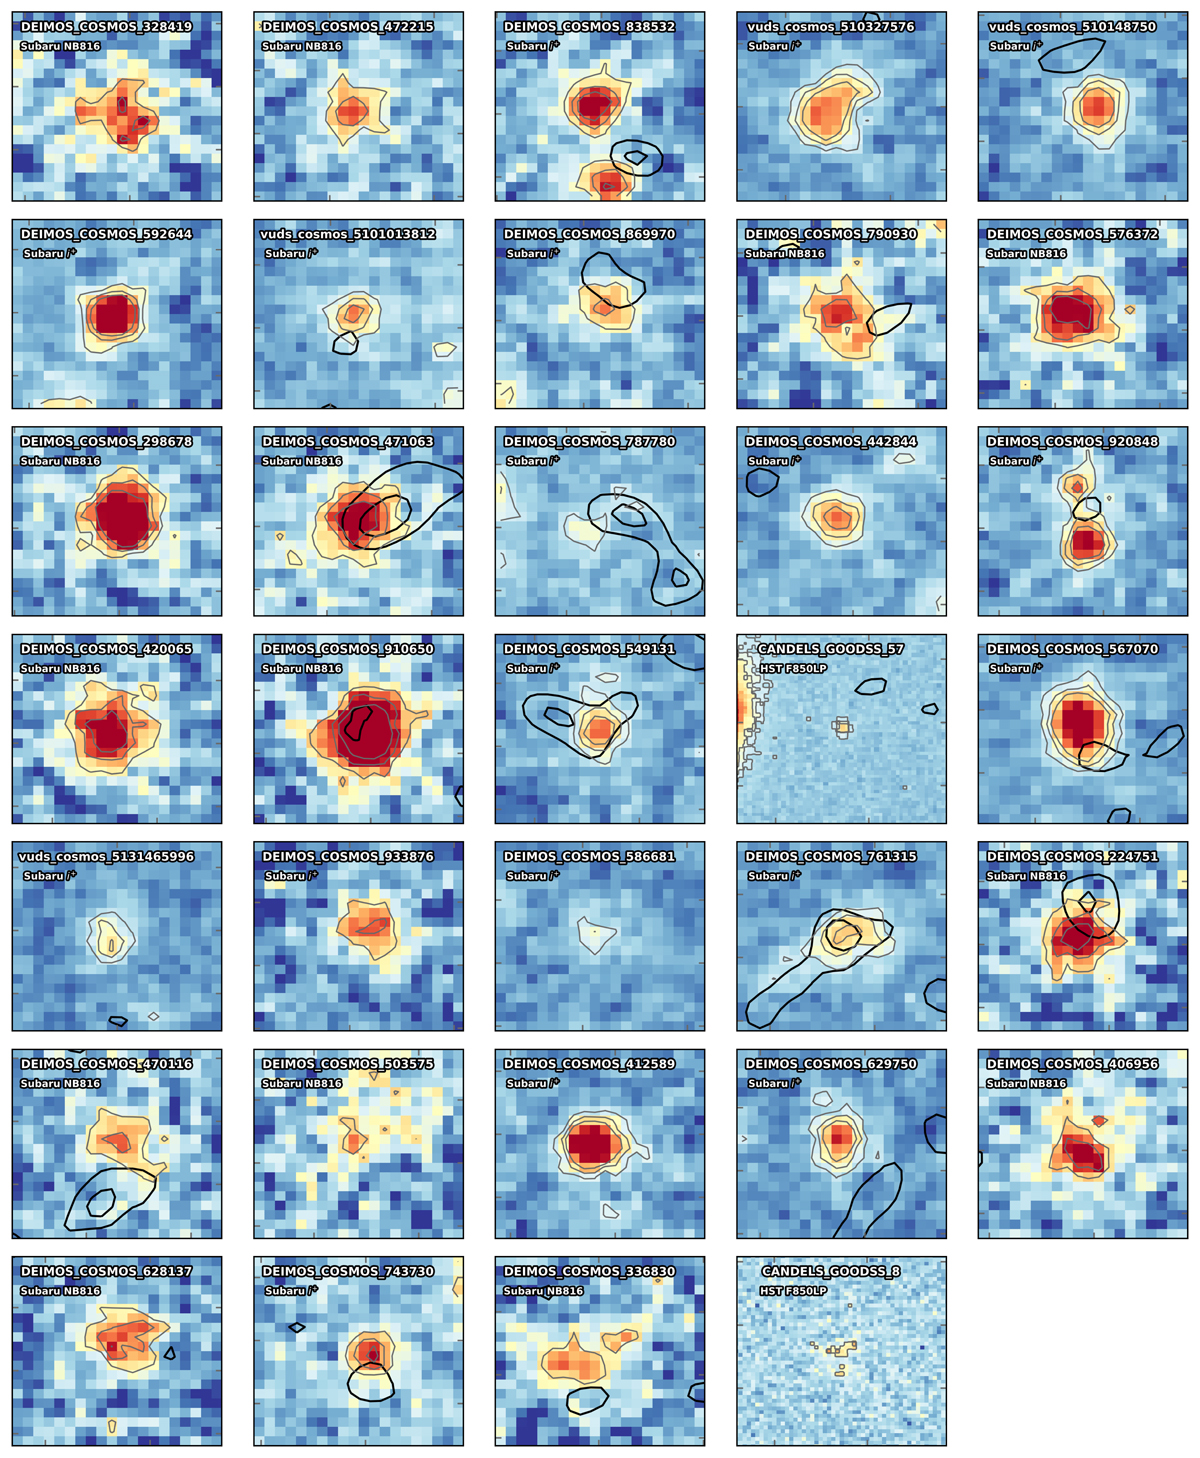
Fig. 3.
Download original image
Cutouts of the 34 [CII] nondetections centered on their optical positions. Depending on the method used to preselect each galaxy before the spectroscopic observation, that is Lyman-break, Lyα, or i-band dropout selection, we show the emission from the Subaru broad-band i+ and narrow-band NB816 filters (Taniguchi et al. 2007, 2015; Laigle et al. 2016), or from the HST/ACS F850LP (Giavalisco et al. 2004), respectively (see Faisst et al. 2020). Each image is 3″ × 3″ wide. Gray contours show 3, 5, and 7σ optical emission. Black contours (if present) represent 2 and 3σ ALMA [CII] emission. The name of each nondetection, as well as the filter used, are reported in the upper-left corner of the corresponding cutout.
Current usage metrics show cumulative count of Article Views (full-text article views including HTML views, PDF and ePub downloads, according to the available data) and Abstracts Views on Vision4Press platform.
Data correspond to usage on the plateform after 2015. The current usage metrics is available 48-96 hours after online publication and is updated daily on week days.
Initial download of the metrics may take a while.