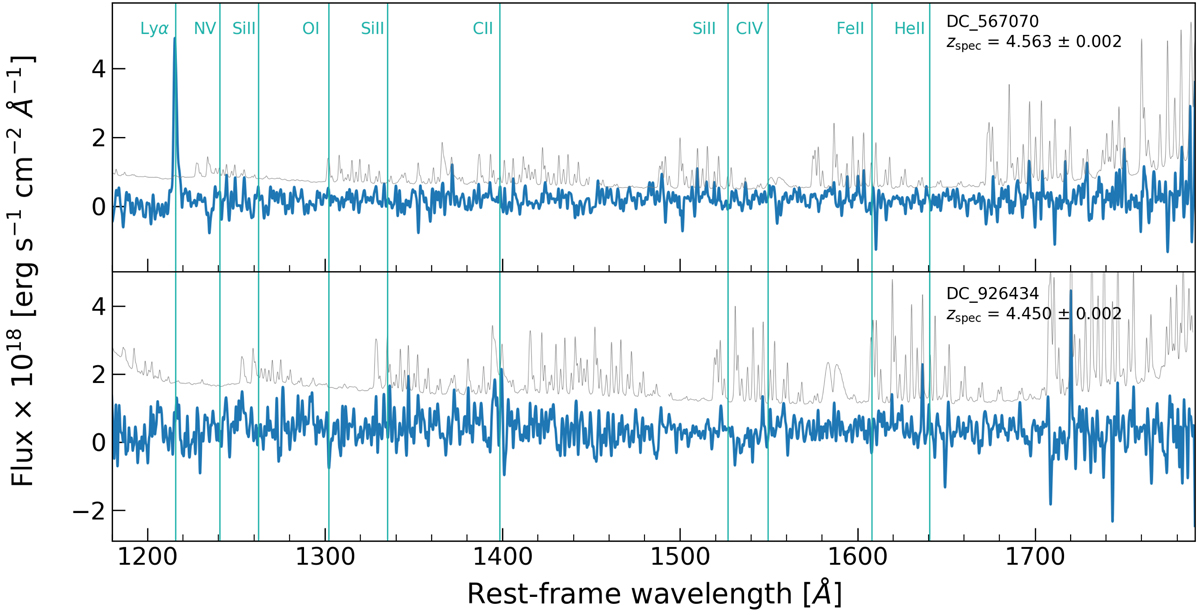
Fig. 2.
Download original image
Examples of optical spectra of two [CII] nondetections with robust (top) and less precise (bottom) rest-frame UV spectroscopic redshift. The typical redshift uncertainty due to the spectral resolution (i.e., R ∼ 2700 from Hasinger et al. 2018) of the observations is also shown. Both panels report UV emission and absorption features, such as the Lyα line or the ISM Si II, C IV and He II absorption lines. The spectra (in blue) and the noise (in gray) are smoothed with a Gaussian filter with size of 2 Å for a better visualization of the emission and absorption features.
Current usage metrics show cumulative count of Article Views (full-text article views including HTML views, PDF and ePub downloads, according to the available data) and Abstracts Views on Vision4Press platform.
Data correspond to usage on the plateform after 2015. The current usage metrics is available 48-96 hours after online publication and is updated daily on week days.
Initial download of the metrics may take a while.