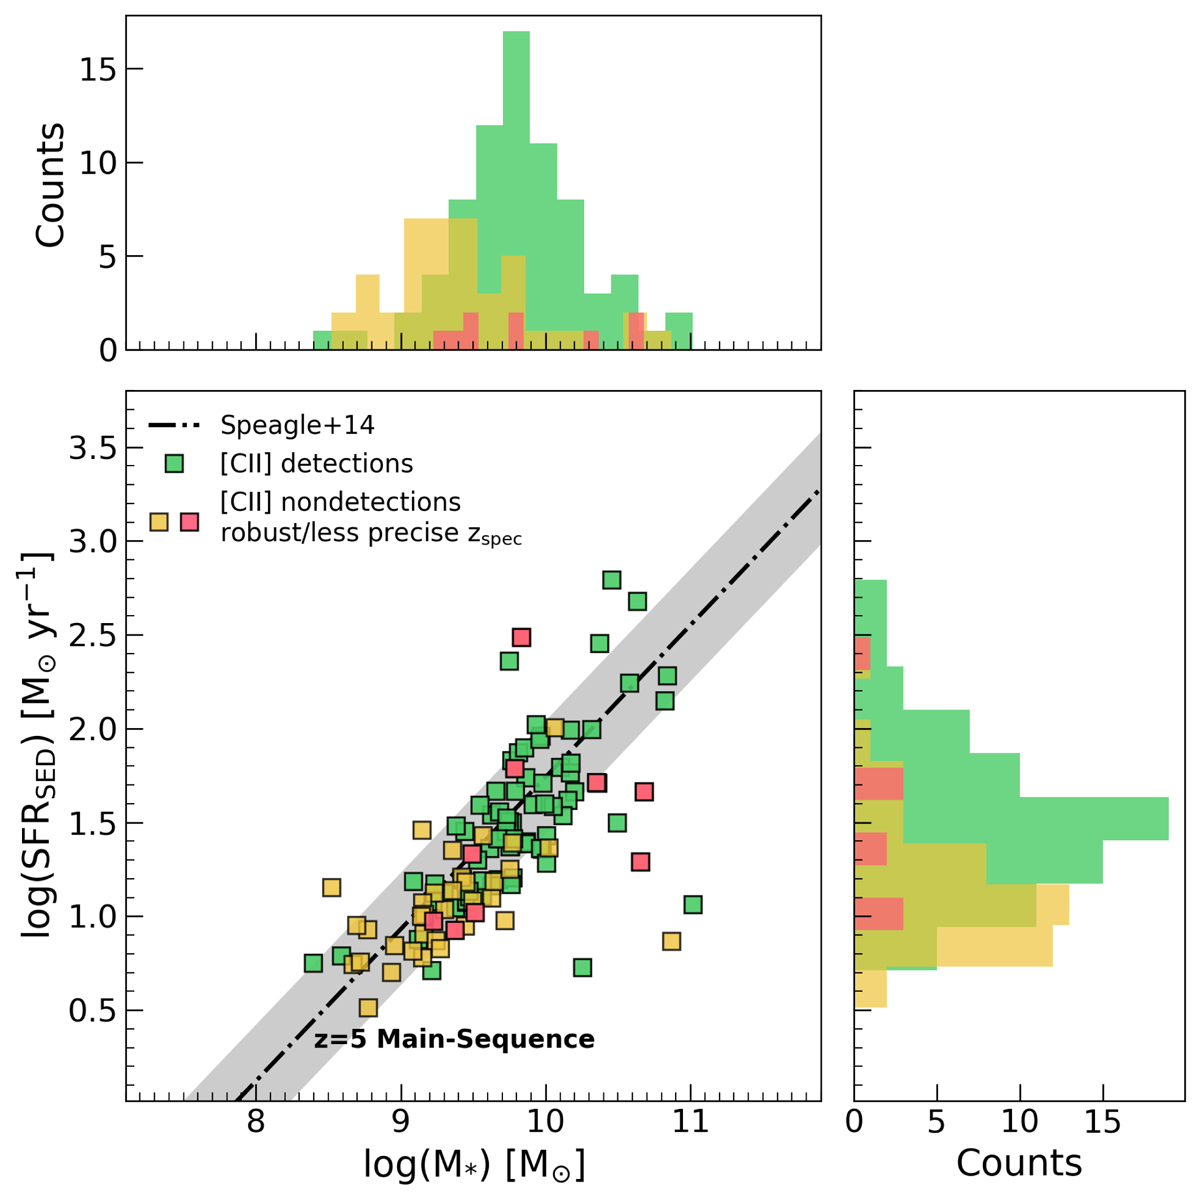
Fig. 1.
Download original image
SFRs vs stellar masses of the ALPINE [CII]-detected (green squares) and undetected (yellow squares) galaxies. Red symbols represent [CII] nondetections with less precise spectroscopic redshift (see Sect. 2.2). The main-sequence of star-forming galaxies by Speagle et al. (2014) is shown as the black dot-dashed line, with its ±0.3 dex width represented by the gray shaded region. Top and right panels report the distributions in stellar mass and SFR, respectively, for both the detections and nondetections.
Current usage metrics show cumulative count of Article Views (full-text article views including HTML views, PDF and ePub downloads, according to the available data) and Abstracts Views on Vision4Press platform.
Data correspond to usage on the plateform after 2015. The current usage metrics is available 48-96 hours after online publication and is updated daily on week days.
Initial download of the metrics may take a while.