Fig. 7.
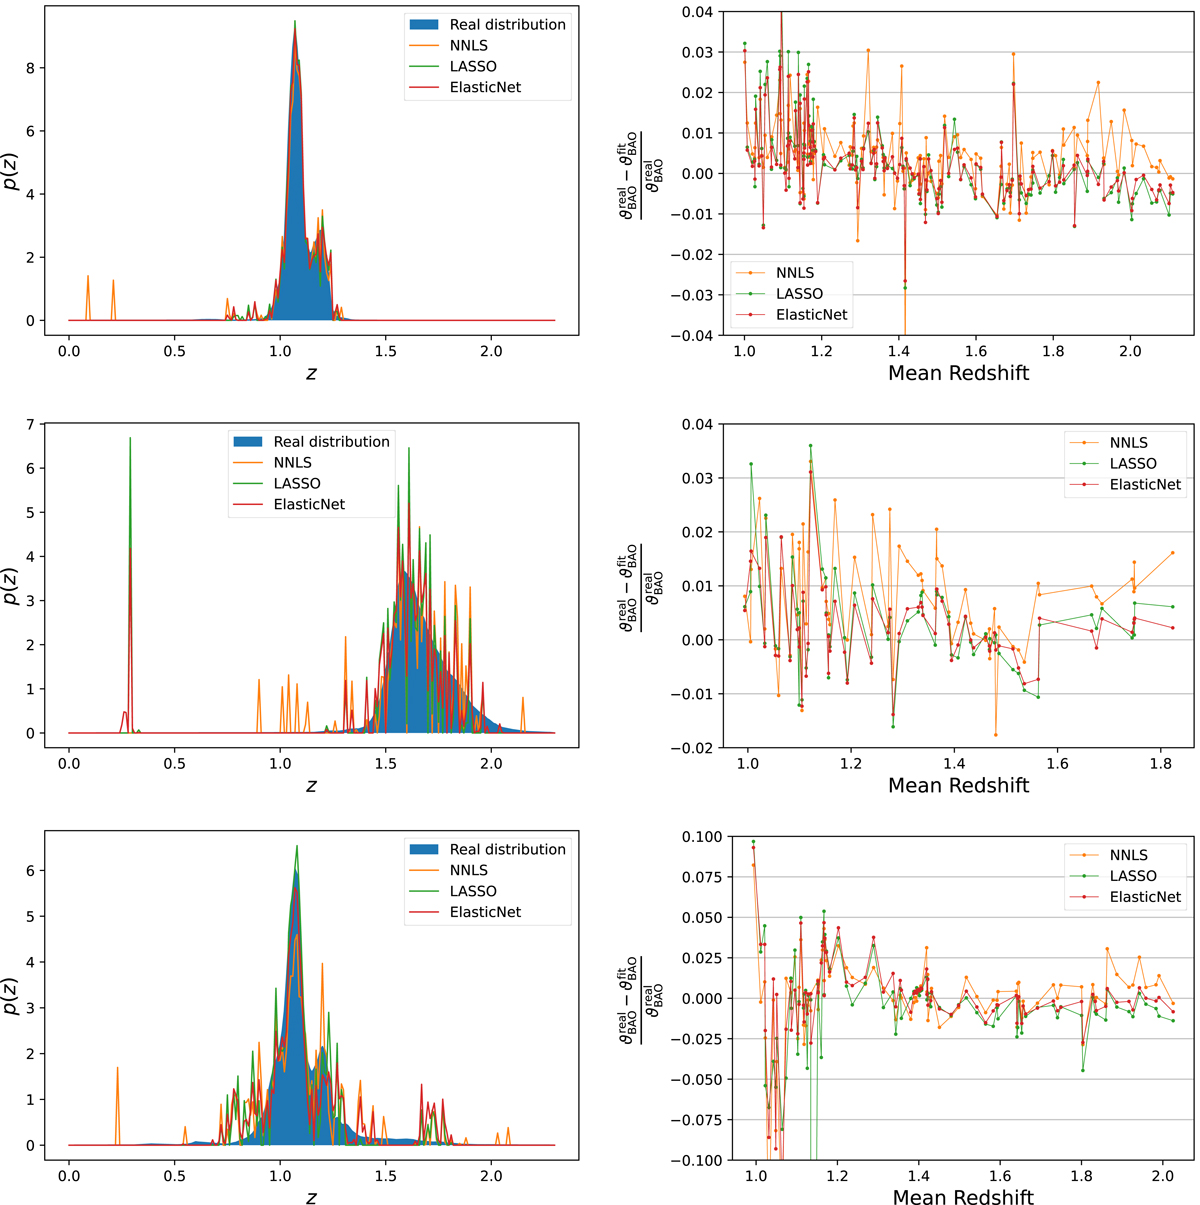
Download original image
Results with noisy spectroscopy. The panels show the same as in Fig. 6, the example redshift distribution fits plotted here are from different colour groups than the ones shown in Fig. 6. The redshift distributions estimated for colour groups at higher redshift tend to be less smooth with a greater frequency of spurious peaks. The LASSO and ElasticNet regression algorithms have free parameters that can be adjusted to give smoother distributions but at the cost of lower accuracy.
Current usage metrics show cumulative count of Article Views (full-text article views including HTML views, PDF and ePub downloads, according to the available data) and Abstracts Views on Vision4Press platform.
Data correspond to usage on the plateform after 2015. The current usage metrics is available 48-96 hours after online publication and is updated daily on week days.
Initial download of the metrics may take a while.