Fig. 1.
Download original image
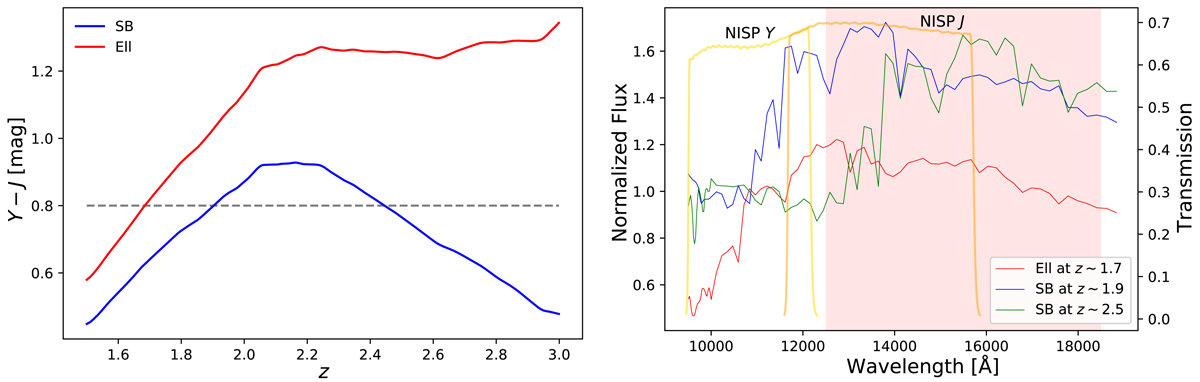
Example of how stacked spectroscopy breaks the colour-redshift degeneracy. Left: to illustrate the method we show a colour degeneracy in Y − J as a function of redshift for starburst (SB) and elliptical (Ell) galaxy templates from Ilbert et al. (2009). The dashed horizontal line indicates Y − J = 0.8 and shows three redshift solutions consistent with the colour: elliptical galaxies at z ∼ 1.7, and starburst galaxies at z ∼ 1.9 and z ∼ 2.5. Right: we see that each solution gives a unique spectral shape in the near infrared range probed by the Euclid NISP instrument (red shaded area). The red line shows the elliptical template at z ∼ 1.7 and the blue and green lines show the starburst template at z ∼ 1.9 and 2.5. The spectra are normalised at the effective wavelength of the Y NISP filter. The Euclid NISP Y and J filter transmission are overplotted. The spectral resolution of the plotted templates is lower than the Euclid NISP spectrograph one. The stacked spectroscopy at fixed colour is built from the linear combination of these templates and encodes enough information to recover the relative contributions of spectral type at each redshift.
Current usage metrics show cumulative count of Article Views (full-text article views including HTML views, PDF and ePub downloads, according to the available data) and Abstracts Views on Vision4Press platform.
Data correspond to usage on the plateform after 2015. The current usage metrics is available 48-96 hours after online publication and is updated daily on week days.
Initial download of the metrics may take a while.