Fig. 1
Download original image
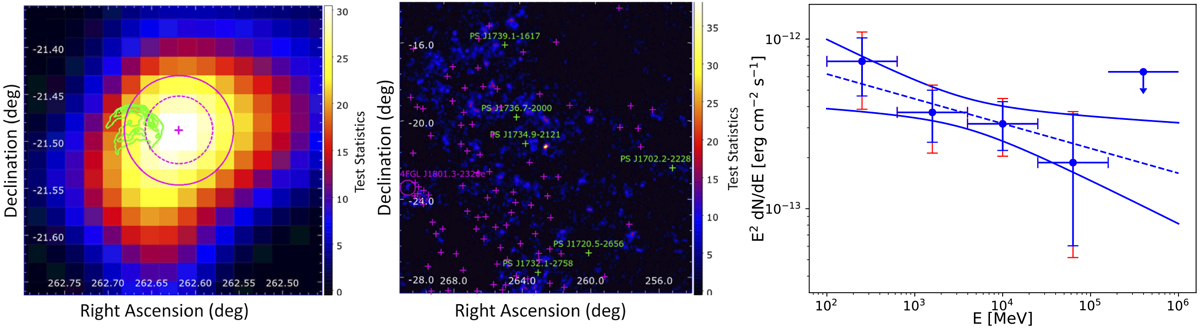
Spatial and spectral characterization of the γ-ray emission results of left panel: zoomed-in view of the Fermi-LAT TS map at the Kepler SNR position above 1 GeV. The green contours are from the infrared 24 μm Spitzer map. The plus symbol and circles illustrate the best-fit position and the 68 and 95% confidence contours. Middle panel: Fermi-LAT TS map of the 15° × 15° ROI around the Kepler SNR above 100 MeV. Magenta plus symbols represent the sources from the 4FGL-DR2 catalog and the green symbols the added point sources. For both TS maps, the Kepler SNR was not included in the model. Right panel: SED of the Kepler SNR obtained using the infrared spatial template. Blue error bars represent the statistical uncertainties, and the red ones correspond to the statistical and systematic uncertainties added in quadrature.
Current usage metrics show cumulative count of Article Views (full-text article views including HTML views, PDF and ePub downloads, according to the available data) and Abstracts Views on Vision4Press platform.
Data correspond to usage on the plateform after 2015. The current usage metrics is available 48-96 hours after online publication and is updated daily on week days.
Initial download of the metrics may take a while.