Fig. 7.
Download original image
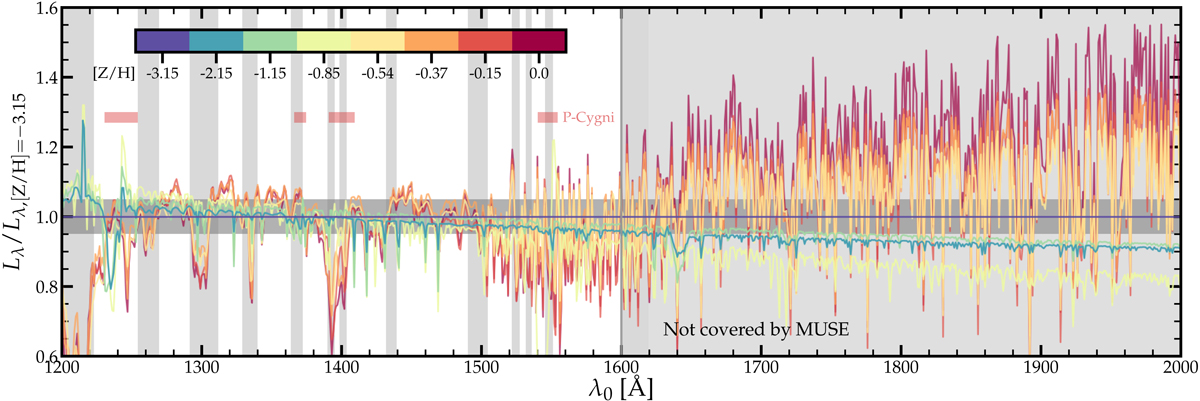
Constraining power of various features in terms of measuring the stellar metallicity of ID53. The vertical grey bands show wavelength regions that are not included in our analysis due to contamination from interstellar absorption or nebular emission (at λ0 < 1600 Å) or because they are not covered by the MUSE data (λ0 > 1600 Å). The coloured lines show the best-fit burst model for each stellar metallicity relative to the lowest-metallicity model. The models are fit to the MUSE data only, ignoring wavelengths with features from interstellar lines or nebular emission. The horizontal grey band illustrates the typical S/N of our data. We illustrate the locations of the N V, O V, Si IV, and C IV P Cygni features in red.
Current usage metrics show cumulative count of Article Views (full-text article views including HTML views, PDF and ePub downloads, according to the available data) and Abstracts Views on Vision4Press platform.
Data correspond to usage on the plateform after 2015. The current usage metrics is available 48-96 hours after online publication and is updated daily on week days.
Initial download of the metrics may take a while.