Fig. 6.
Download original image
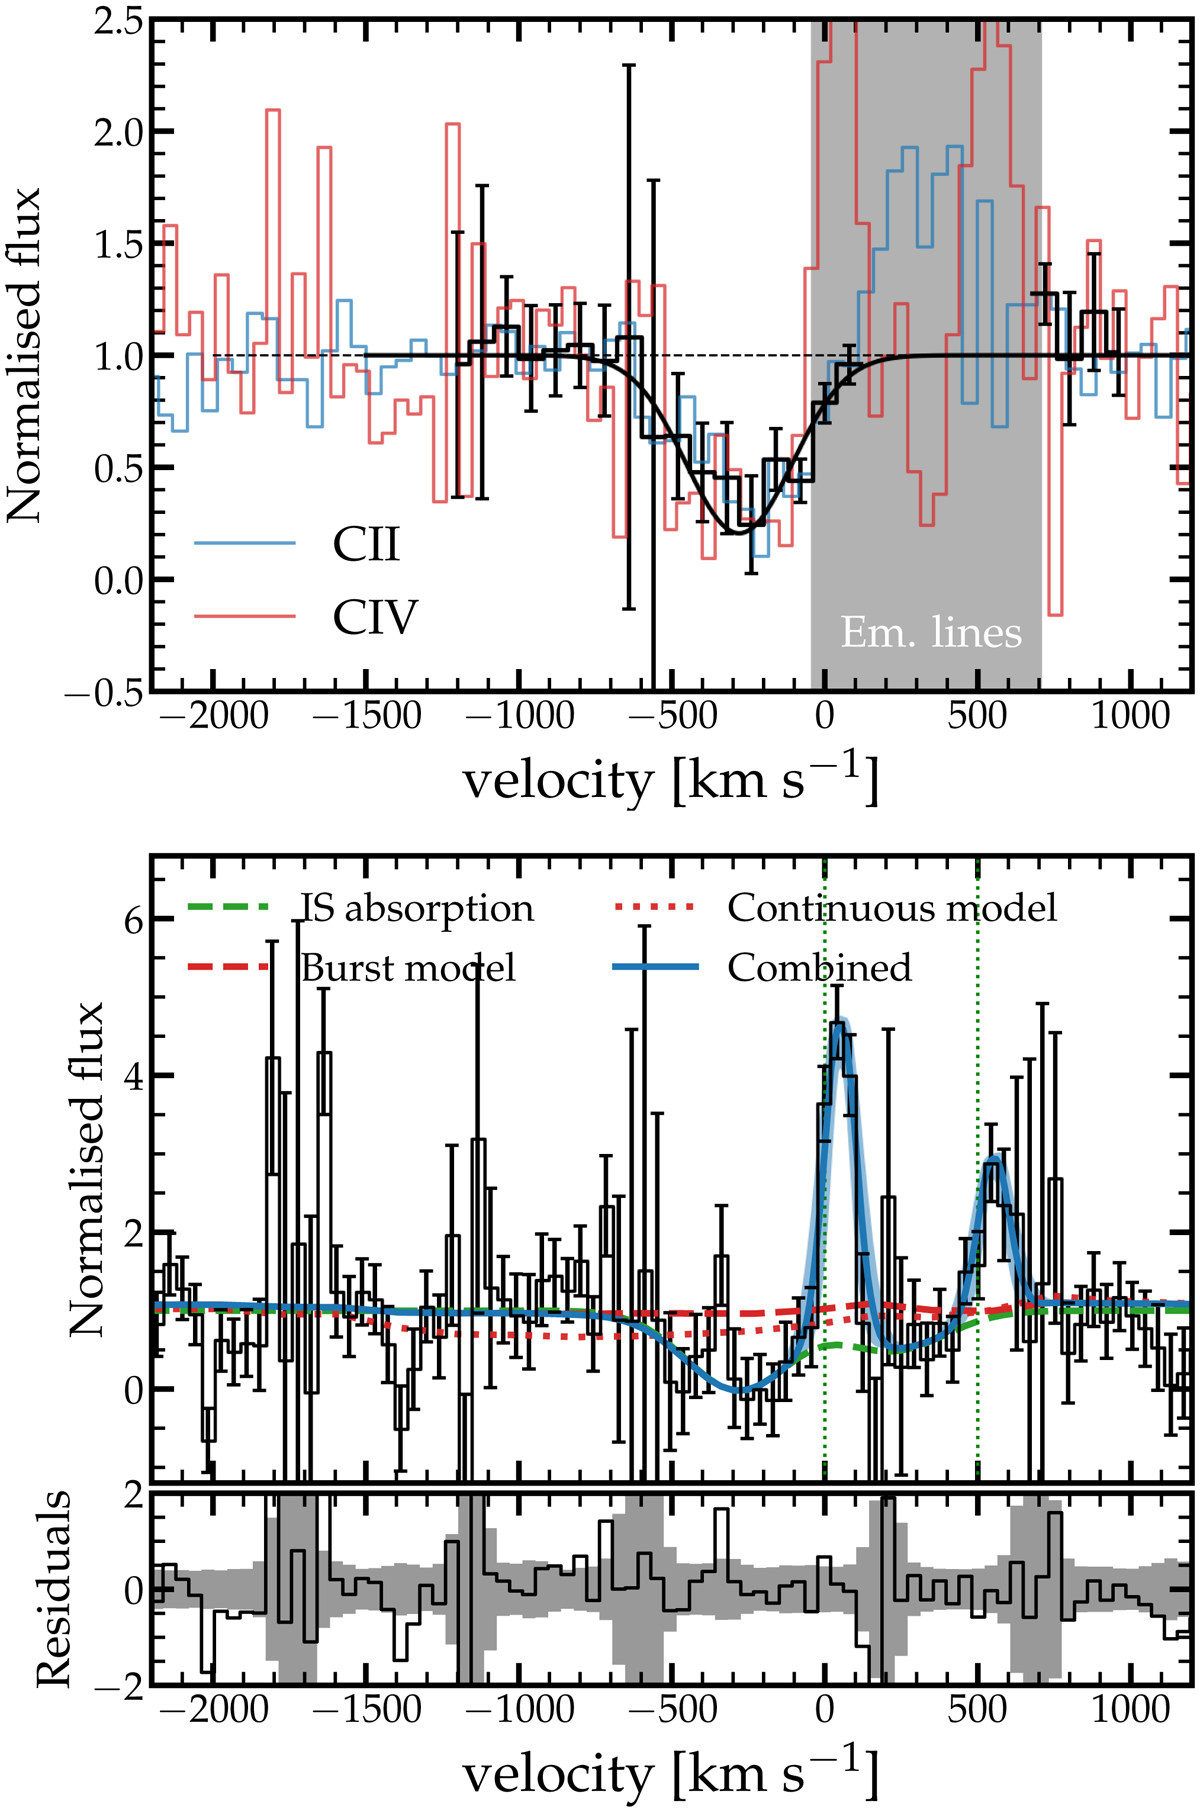
Detailed spectrum of the C IV line emission in ID53. Top: C II1334 (blue) and C IV1548 (red) absorption in the integrated spectrum of ID53. The black data show the inverse-variance-weighted average of the two absorption transitions masking emission lines. The solid black line shows the best-fit Gaussian absorption profile. The grey shaded region highlights the position of the C IV line that has been masked when measuring the weighted averaged spectrum. Bottom: C IV1548, 1550 emission lines and the nearby continuum and absorption features. The velocity axes is plotted with respect to the rest-frame velocity of the C IV1548 line. The blue line shows the combined model of absorption, continuum, and emission, and its uncertainties. The combined model consists of stellar continuum (dashed red line), interstellar absorption (dashed green line), and nebular emission (blue shaded areas mark the 1σ confidence interval). The small panel at the bottom shows the residuals between the combined model and data.
Current usage metrics show cumulative count of Article Views (full-text article views including HTML views, PDF and ePub downloads, according to the available data) and Abstracts Views on Vision4Press platform.
Data correspond to usage on the plateform after 2015. The current usage metrics is available 48-96 hours after online publication and is updated daily on week days.
Initial download of the metrics may take a while.