Fig. 4.
Download original image
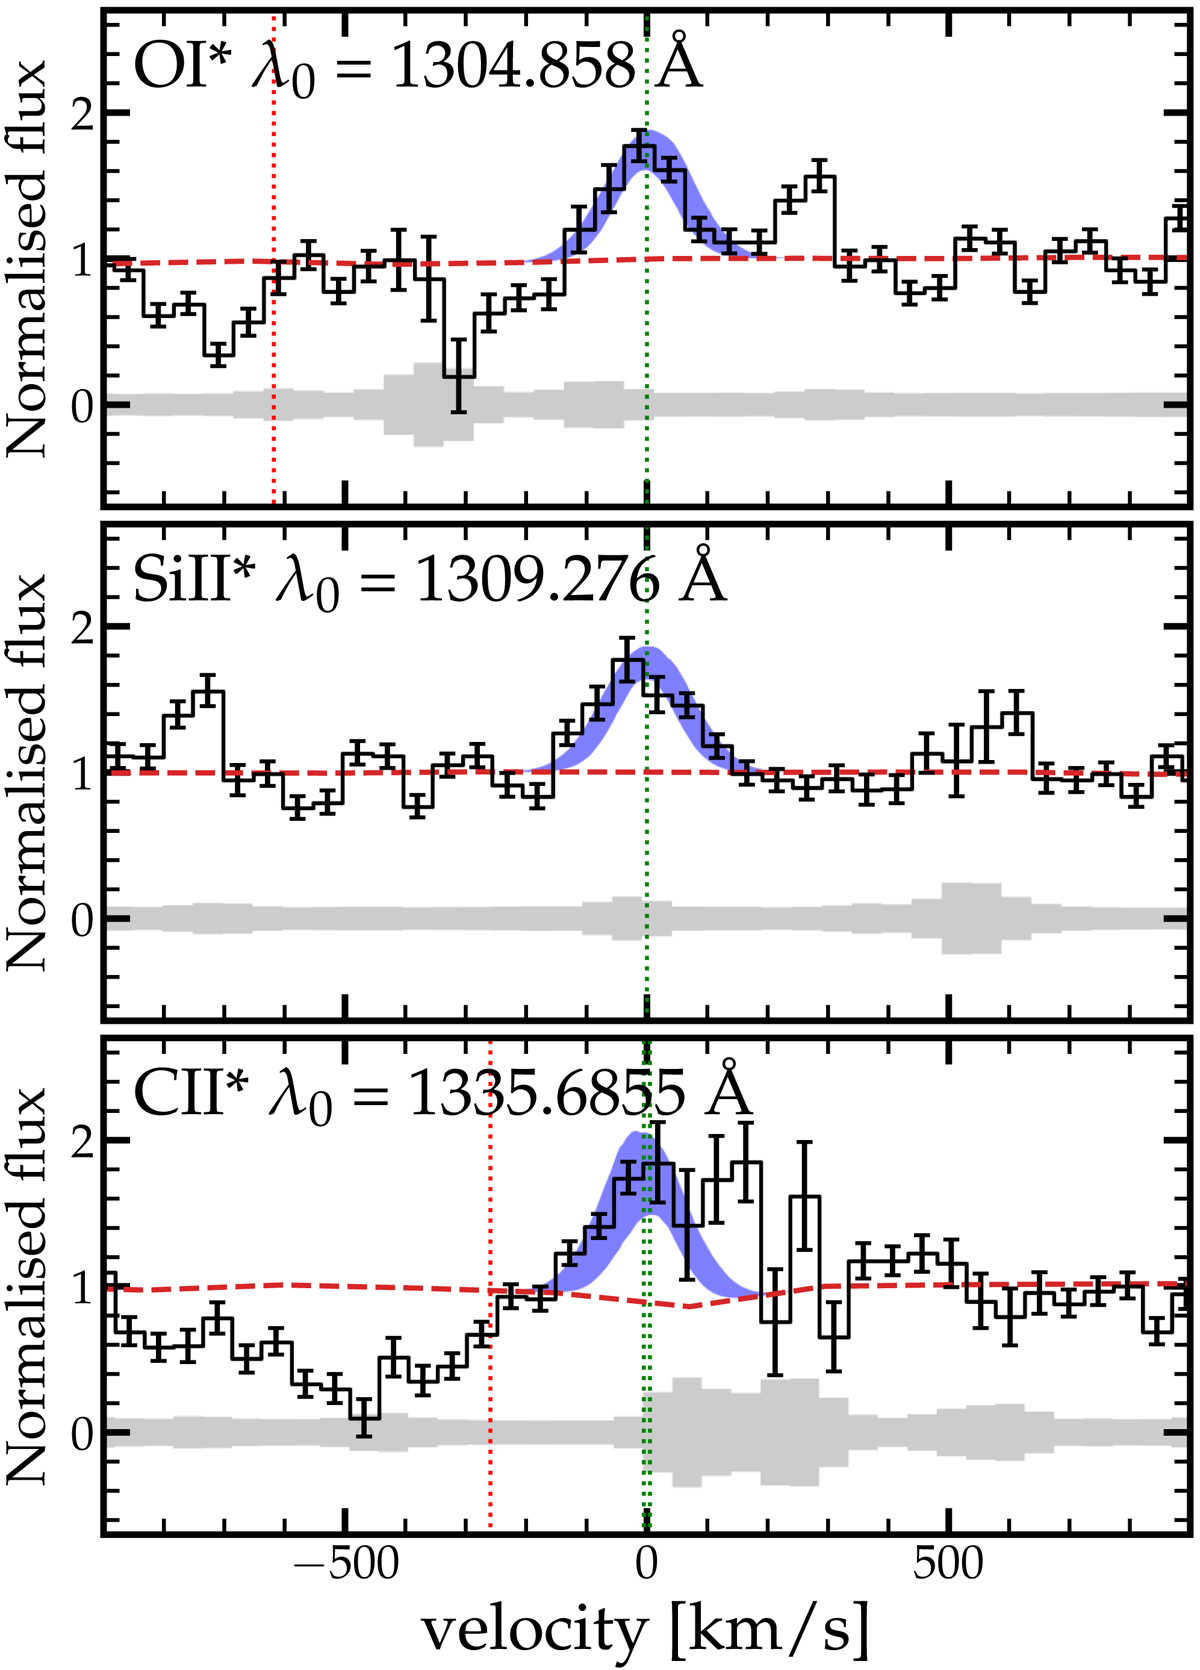
Non-resonant fine-structure emission lines detected in ID53 (except for Si II![]() , which is not shown). Vertical green lines mark the positions of the emission lines, and red lines mark the expected positions of absorption lines at their rest-frame velocity. The blue shaded region shows the fitted Gaussian profiles of the emission lines and their uncertainties. The dashed red line shows the underlying stellar continuum from the best-fit model with a single-burst SFH. We note that skyline contamination impacts the C II* line profile.
, which is not shown). Vertical green lines mark the positions of the emission lines, and red lines mark the expected positions of absorption lines at their rest-frame velocity. The blue shaded region shows the fitted Gaussian profiles of the emission lines and their uncertainties. The dashed red line shows the underlying stellar continuum from the best-fit model with a single-burst SFH. We note that skyline contamination impacts the C II* line profile.
Current usage metrics show cumulative count of Article Views (full-text article views including HTML views, PDF and ePub downloads, according to the available data) and Abstracts Views on Vision4Press platform.
Data correspond to usage on the plateform after 2015. The current usage metrics is available 48-96 hours after online publication and is updated daily on week days.
Initial download of the metrics may take a while.