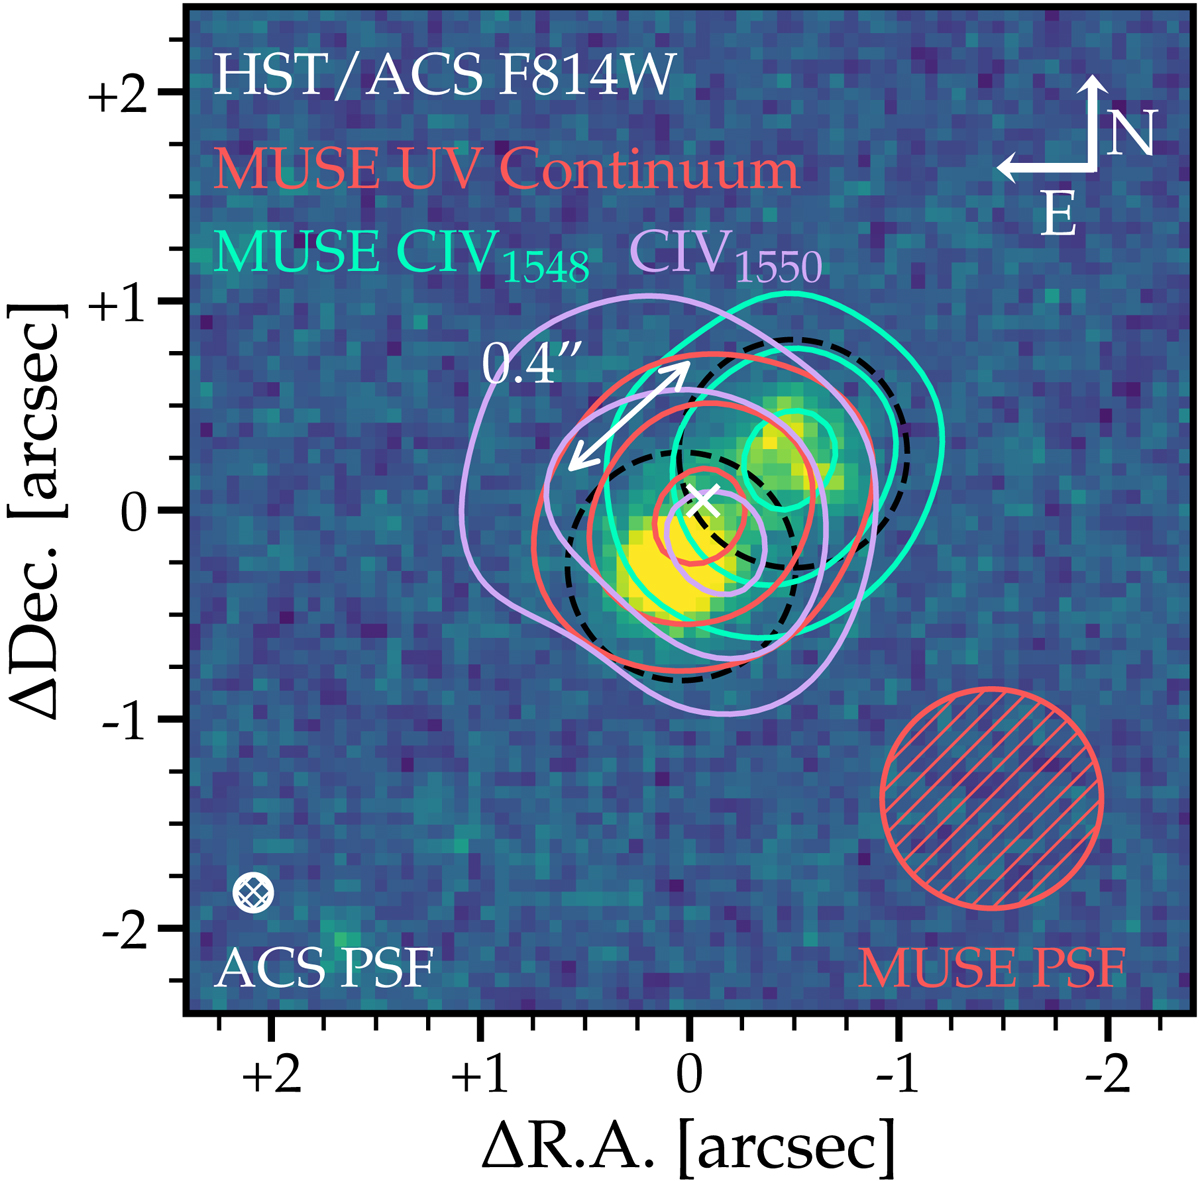
Fig. 3.
Download original image
HST/ACS F814W image of ID53 from the eXtreme Deep Field project (Illingworth et al. 2013). The F814W filter traces the rest-frame UV emission that is also traced by the MUSE spectrum. The PSF-FWHM of the MUSE data is shown in the bottom right corner for comparison. The white cross marks the centre of the Lyα emission. ID53 consists of (at least) two components in the high-resolution imaging. These are significantly blended in the MUSE continuum (red). Spatial offsets are seen for pseudo-narrow bands of the C IV1548, 1550 emission. The bluer line (shown in cyan) spatially peaks at the fainter UV component, but the C IV1550 line peaks at the position of the continuum, which is suggestive of strongly overlapping C IV lines at slightly different redshifts. Dashed black circles show the FWHM of the extraction apertures of point sources in the NW and SE in the MUSE data, respectively. These extractions are shown in Fig. 5.
Current usage metrics show cumulative count of Article Views (full-text article views including HTML views, PDF and ePub downloads, according to the available data) and Abstracts Views on Vision4Press platform.
Data correspond to usage on the plateform after 2015. The current usage metrics is available 48-96 hours after online publication and is updated daily on week days.
Initial download of the metrics may take a while.