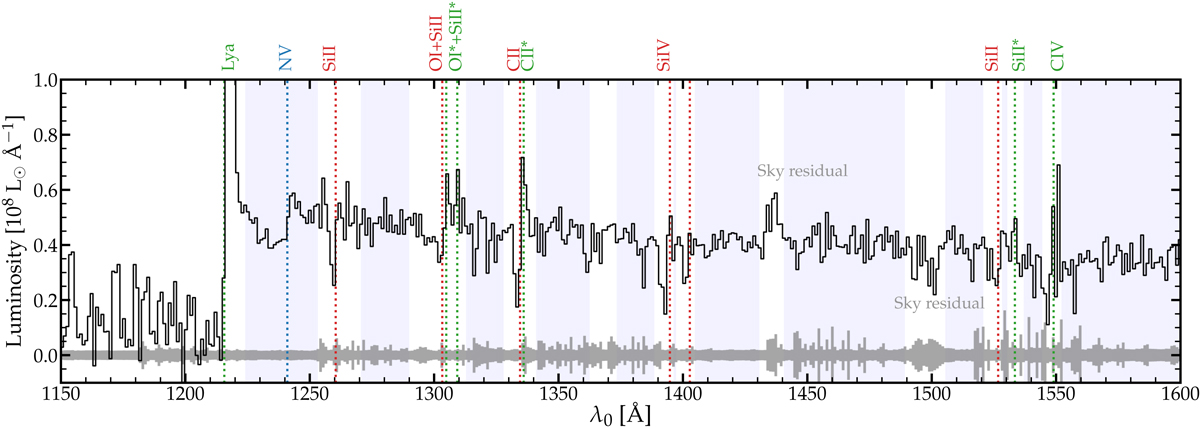
Fig. 1.
Download original image
Rest-frame 1D spectrum of ID53 extracted from the MXDF data (black line), binned by a factor 5 in the wavelength direction. The spectrum is shifted to the rest-frame based on zsys = 4.7745 and scaled to rest-frame luminosity density. The range of the y-axis is limited for visualisation purposes. The grey shaded region shows the noise level and particularly visualises the locations of skylines. Dotted red lines mark the expected locations of interstellar absorption lines, dotted green lines mark emission lines, and the dotted blue line marks the stellar N V feature. We also highlight two wavelength regions that are affected by significant skyline residuals. The blue shaded regions highlight spectral regions that have been included in the fitting of the stellar continuum.
Current usage metrics show cumulative count of Article Views (full-text article views including HTML views, PDF and ePub downloads, according to the available data) and Abstracts Views on Vision4Press platform.
Data correspond to usage on the plateform after 2015. The current usage metrics is available 48-96 hours after online publication and is updated daily on week days.
Initial download of the metrics may take a while.