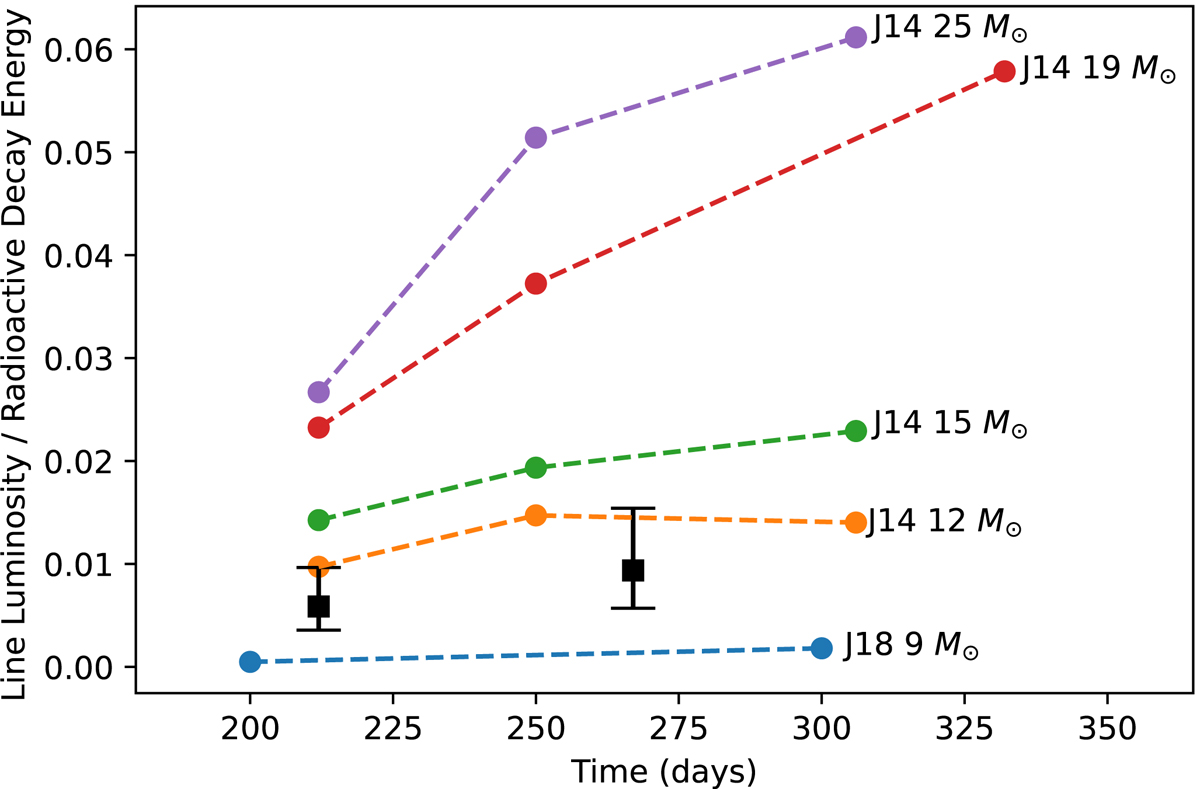
Fig. 8.
Download original image
Normalized line luminosities of the [O I] doublet (λ 6300,6364 Å) at different time epochs for the observed spectra of SN 2020qmp as well as the models from Jerkstrand et al. (2014, 2018). The observed luminosities from SN 2020qmp are plotted as squares, with their error bars in black; the models are each plotted with circles, with different colors corresponding to the different models.
Current usage metrics show cumulative count of Article Views (full-text article views including HTML views, PDF and ePub downloads, according to the available data) and Abstracts Views on Vision4Press platform.
Data correspond to usage on the plateform after 2015. The current usage metrics is available 48-96 hours after online publication and is updated daily on week days.
Initial download of the metrics may take a while.