Fig. 4.
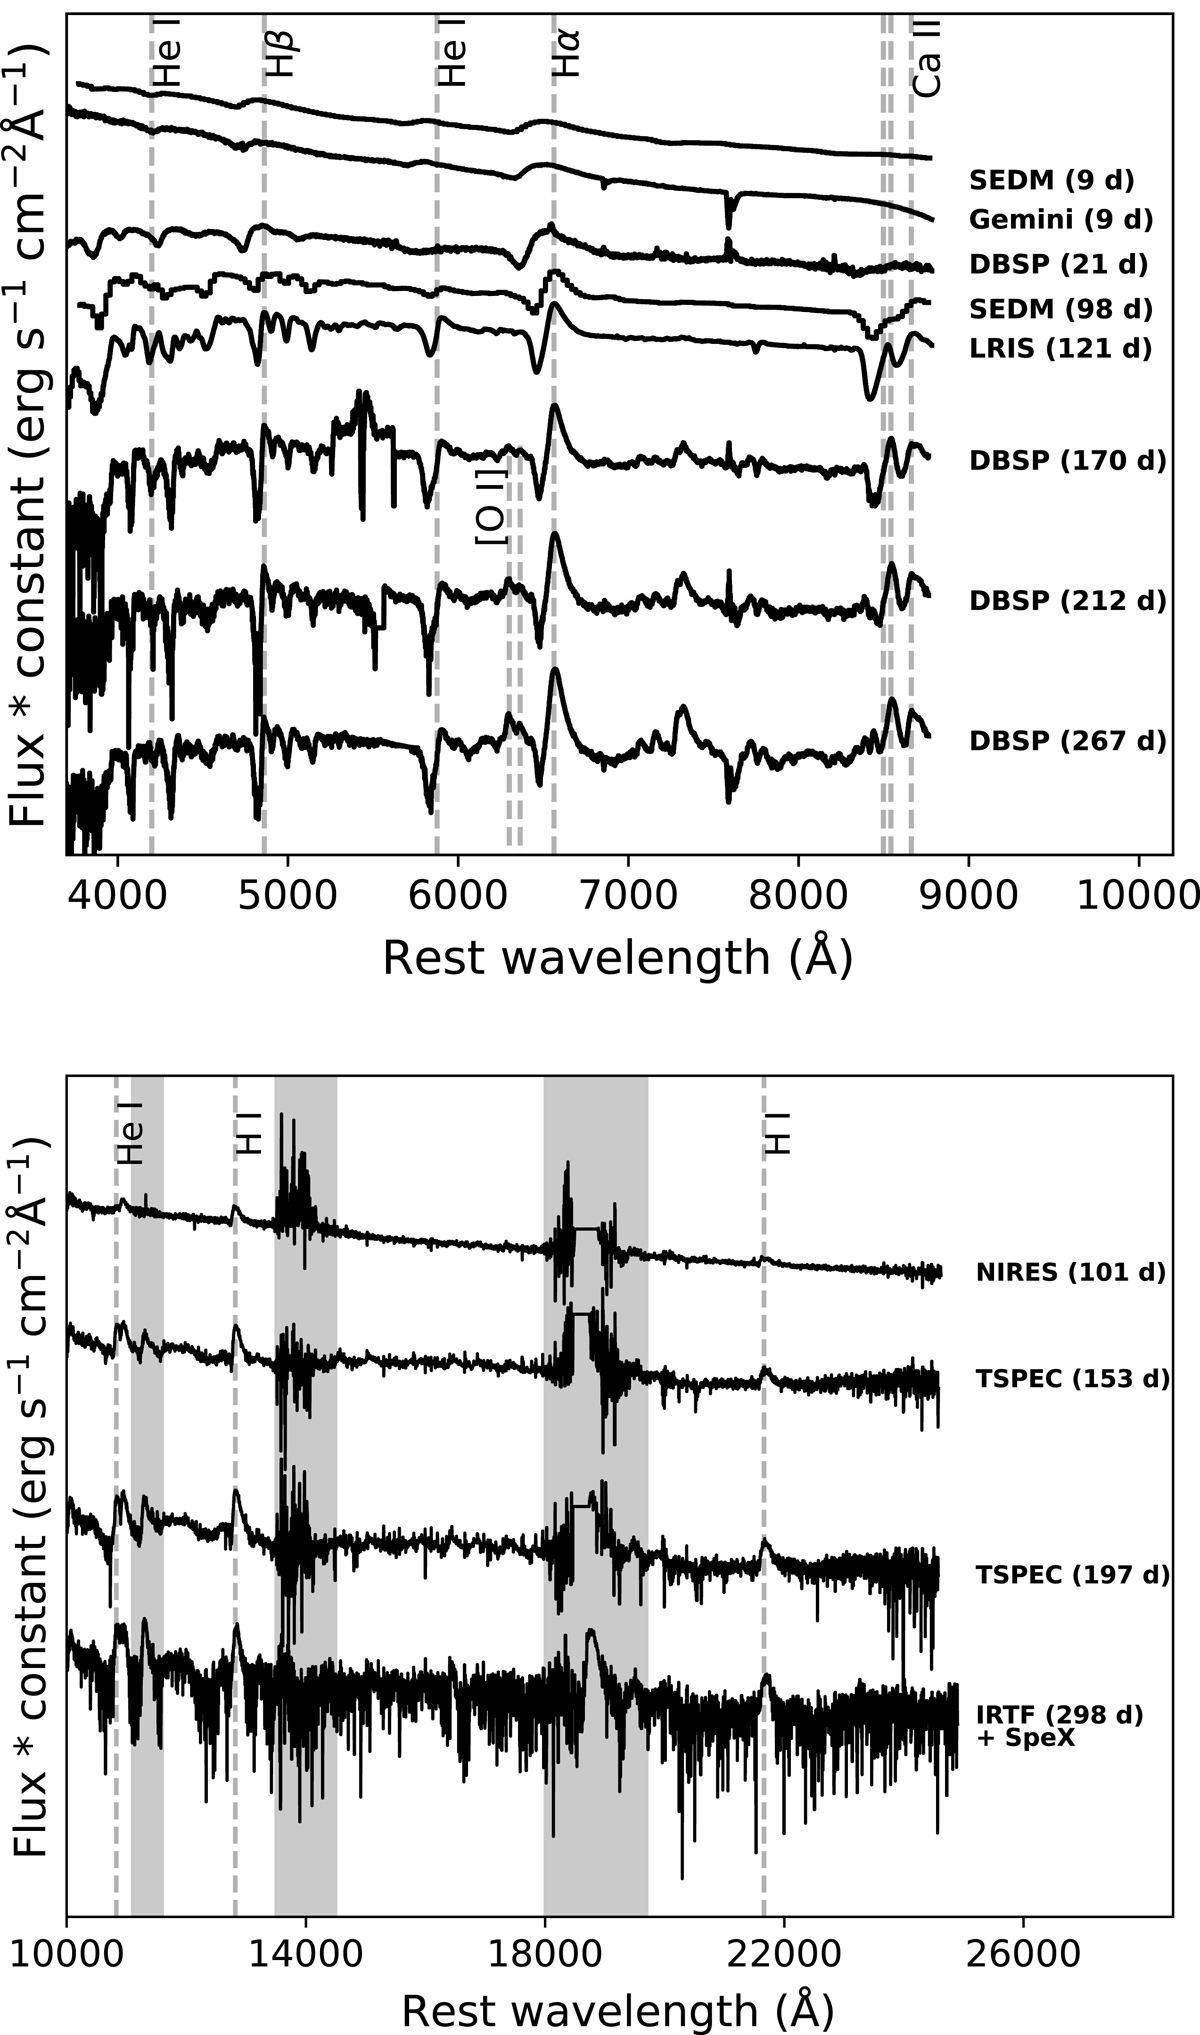
Download original image
Spectra obtained of SN 2020qmp, in the optical and NIR. Top panel: spectral evolution in the optical of SN 2020qmp. The most prominent spectral features are labeled, with the instruments and phases shown to the right of the spectrum. Bottom panel: spectral evolution in the NIR of SN 2020qmp, with the same labels as in the top panel. Areas of atmospheric absorption are indicated with gray bands.
Current usage metrics show cumulative count of Article Views (full-text article views including HTML views, PDF and ePub downloads, according to the available data) and Abstracts Views on Vision4Press platform.
Data correspond to usage on the plateform after 2015. The current usage metrics is available 48-96 hours after online publication and is updated daily on week days.
Initial download of the metrics may take a while.