Fig. 3.
Download original image
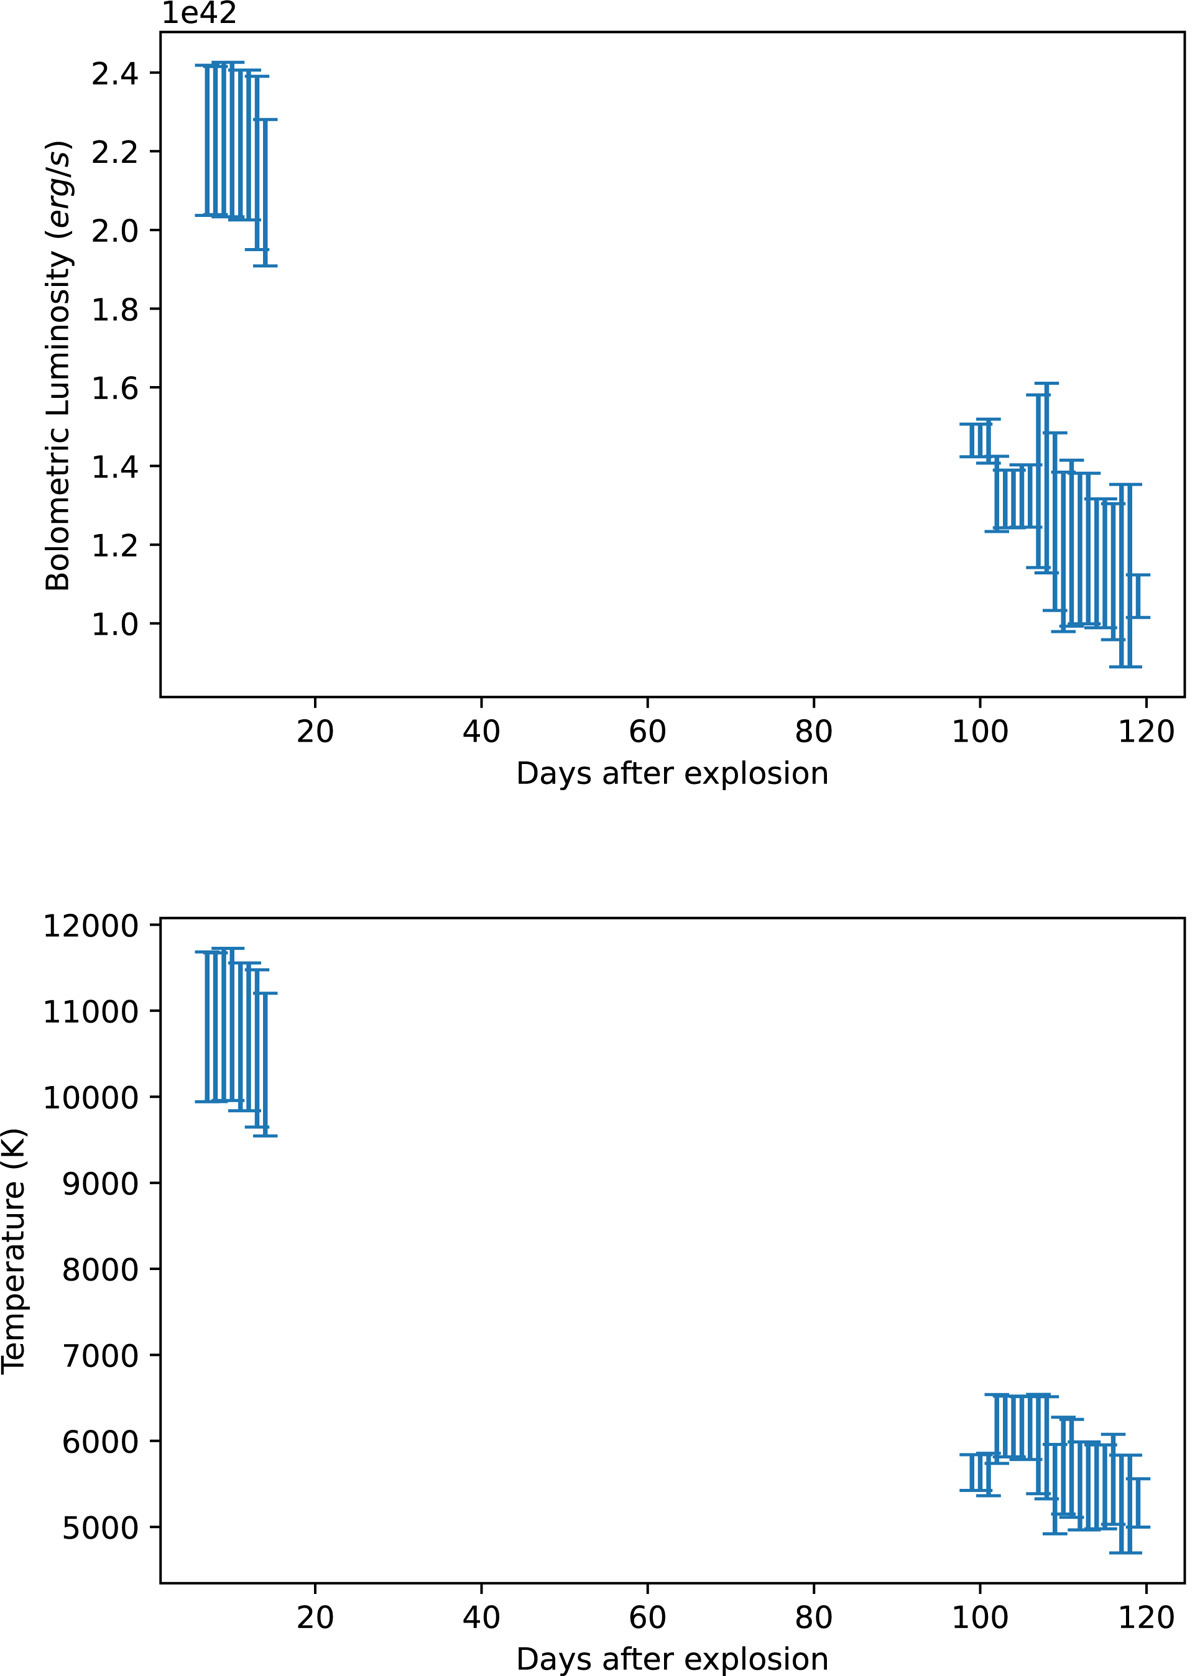
Bolometric LC and temperature evolution of SN 2020qmp until the end of the plateau phase. Top panel: bolometric LC of SN 2020qmp up until the end of the plateau phase. The errors displayed in the plot are obtained from individual measurement errors, but we note that an overall distance uncertainty to the source of 0.54 mag dominates the overall error. Bottom panel: temperature evolution over the plateau phase of the blackbody fits used to derive the bolometric luminosities.
Current usage metrics show cumulative count of Article Views (full-text article views including HTML views, PDF and ePub downloads, according to the available data) and Abstracts Views on Vision4Press platform.
Data correspond to usage on the plateform after 2015. The current usage metrics is available 48-96 hours after online publication and is updated daily on week days.
Initial download of the metrics may take a while.