Fig. 14.
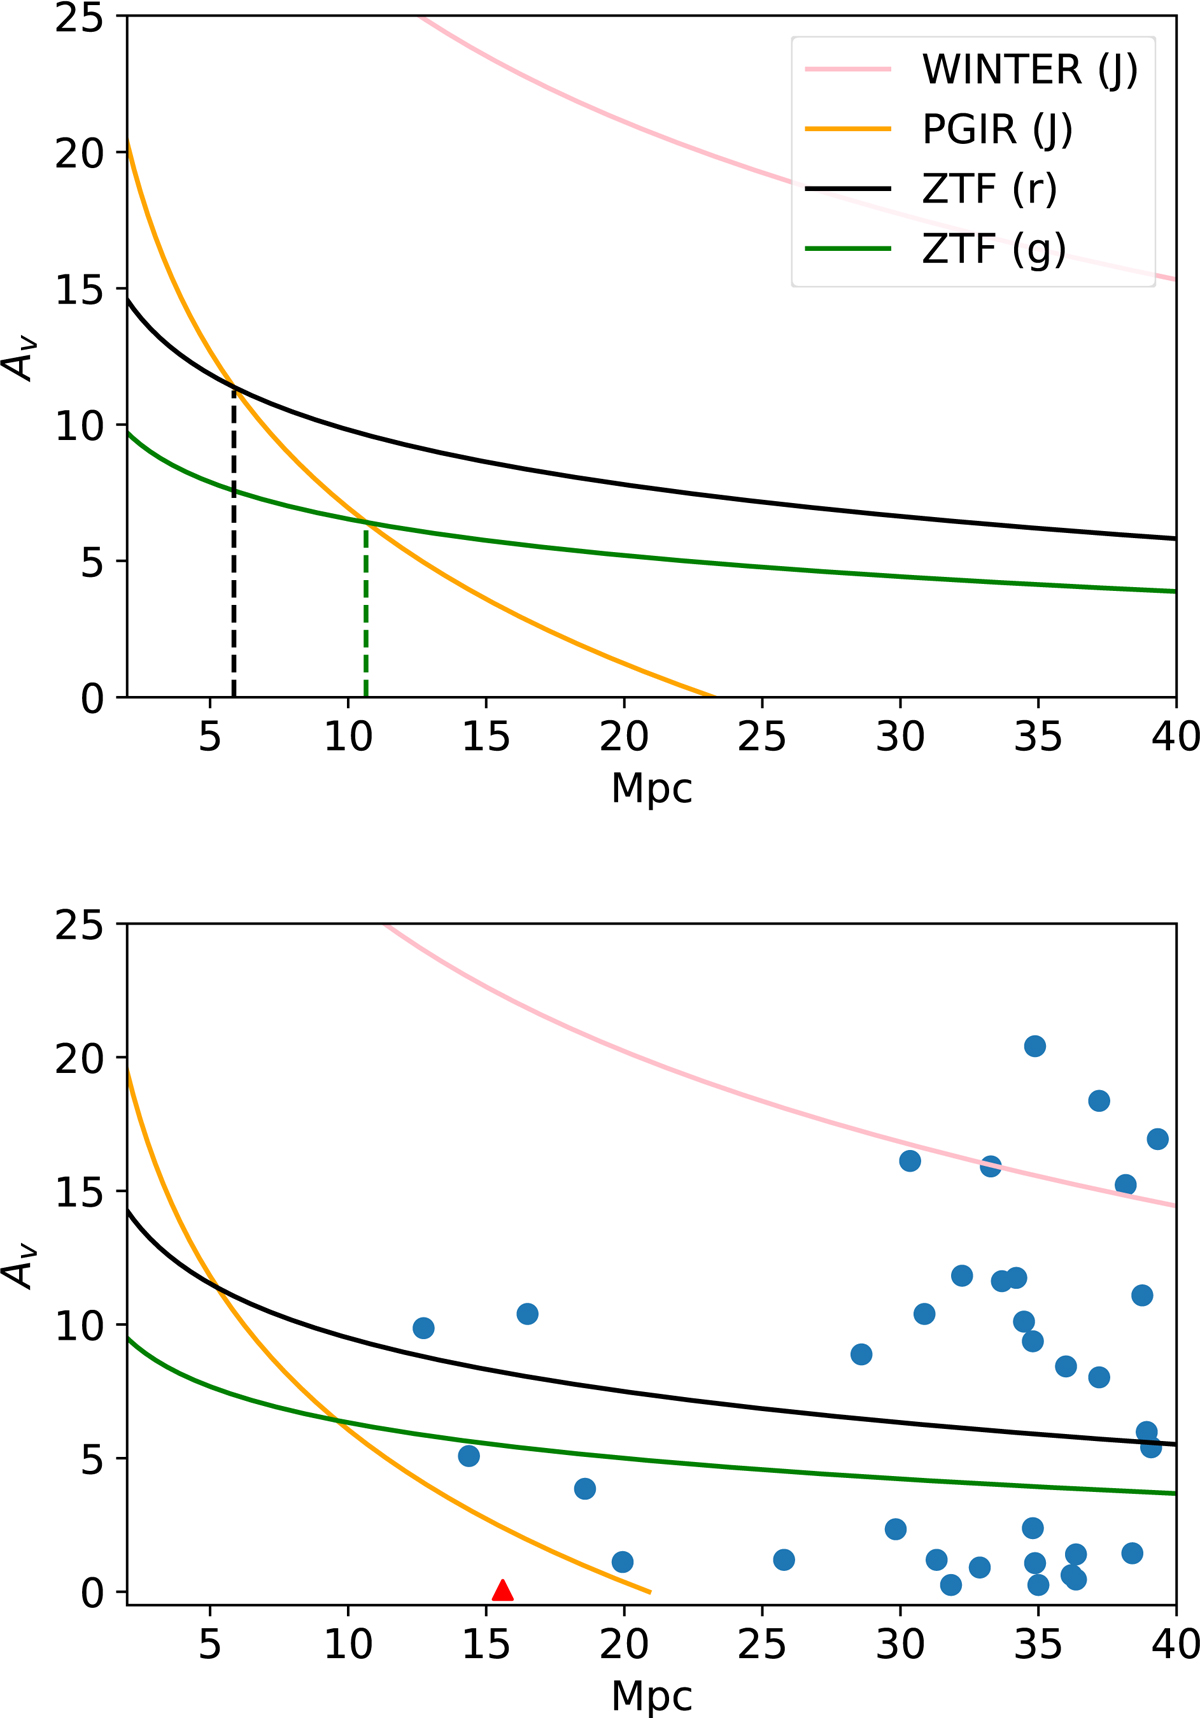
Download original image
Sensitivity curves and CCSNe simulation detailed in the text. Top panel: comparison of PGIR’s sensitivity to detecting Type IIP CCSNe as a function of distance and extinction to that of ZTF’s r and g bands, assuming an absolute AB magnitude of −16.8 for every SN. The proposed WINTER survey’s sensitivity is also shown. The vertical lines are the distances (in Mpc) where PGIR is more sensitive to extinguished CCSNe than ZTF. Bottom panel: simulated Type IIP CCSNe over a five-year span using an extinction distribution derived from the CCSN candidate sample of Jencson et al. (2019). Details of the simulation are given in the main text, and the sensitivity curves are the same as in the top panel. SN 2020qmp in particular is marked in red and as a triangle to demonstrate its placement compared to the simulated distribution.
Current usage metrics show cumulative count of Article Views (full-text article views including HTML views, PDF and ePub downloads, according to the available data) and Abstracts Views on Vision4Press platform.
Data correspond to usage on the plateform after 2015. The current usage metrics is available 48-96 hours after online publication and is updated daily on week days.
Initial download of the metrics may take a while.