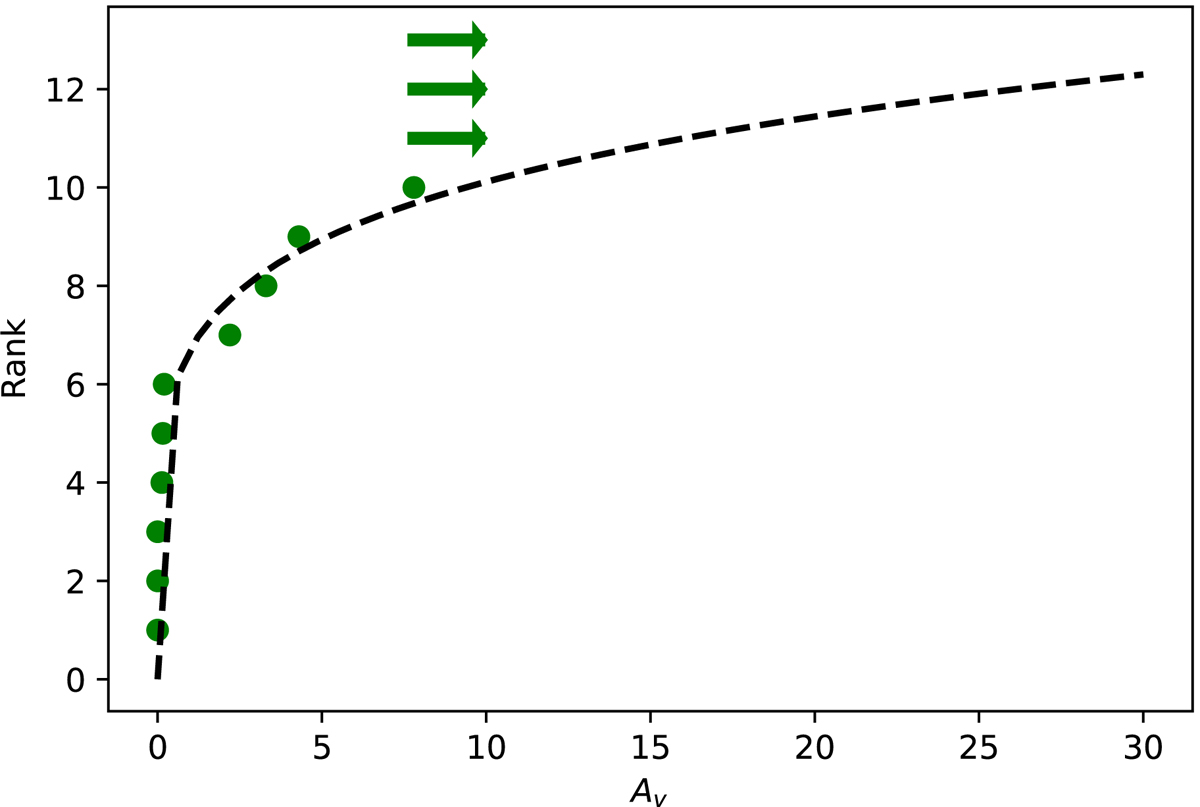
Fig. 13.
Download original image
Cumulative distribution along with a power-law fit of the extinction distribution from Jencson et al. (2019) used in the simulation. This cumulative distribution represents the most extreme extinction scenario, with all lower limits in the sample assigned the highest extinction value in the sample of AV = 7.8, indicated with arrows.
Current usage metrics show cumulative count of Article Views (full-text article views including HTML views, PDF and ePub downloads, according to the available data) and Abstracts Views on Vision4Press platform.
Data correspond to usage on the plateform after 2015. The current usage metrics is available 48-96 hours after online publication and is updated daily on week days.
Initial download of the metrics may take a while.