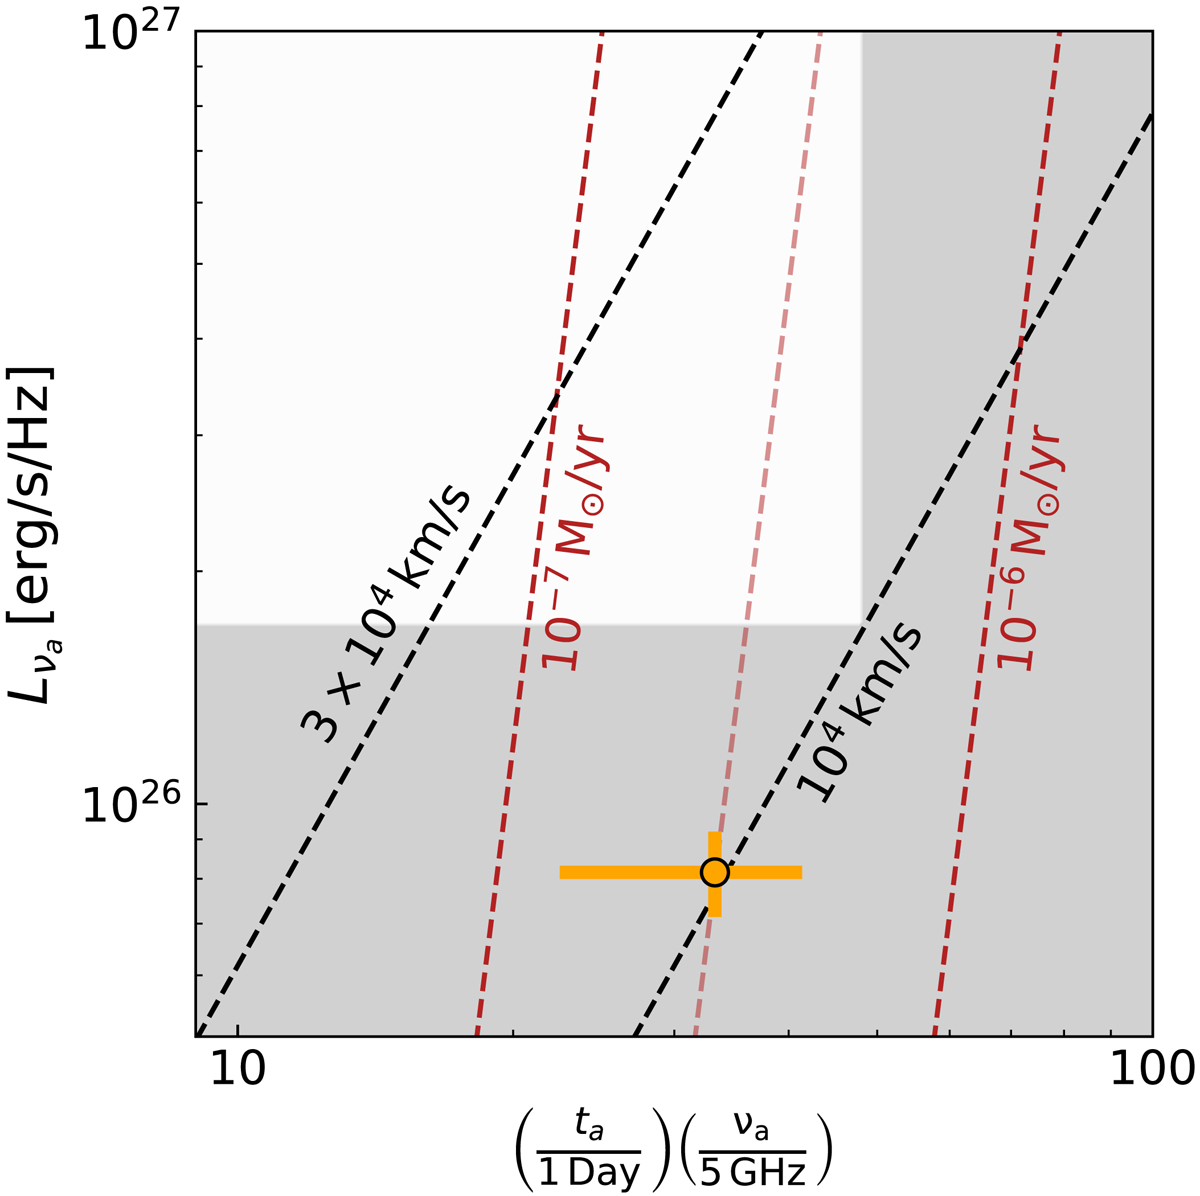
Fig. 12.
Download original image
Chevalier’s diagram for SN2020 qmp. The orange point is the position of the radio spectral peak derived 57 days after the explosion. Under the assumption of a shockwave traveling with a constant velocity in a simple r−2 CSM density structure, the position of the peak should remain constant. However, the shaded region, which is the ruled out region derived from the limit on the radio spectral peak on the subsequent observation (on day 104), is in disagreement with the radio spectral peak obtained before. This disagreement points toward a nontypical CSM structure. Also plotted for reference are equal lines of shock velocities and mass-loss rates (assuming a wind velocity of 10 km s−1).
Current usage metrics show cumulative count of Article Views (full-text article views including HTML views, PDF and ePub downloads, according to the available data) and Abstracts Views on Vision4Press platform.
Data correspond to usage on the plateform after 2015. The current usage metrics is available 48-96 hours after online publication and is updated daily on week days.
Initial download of the metrics may take a while.