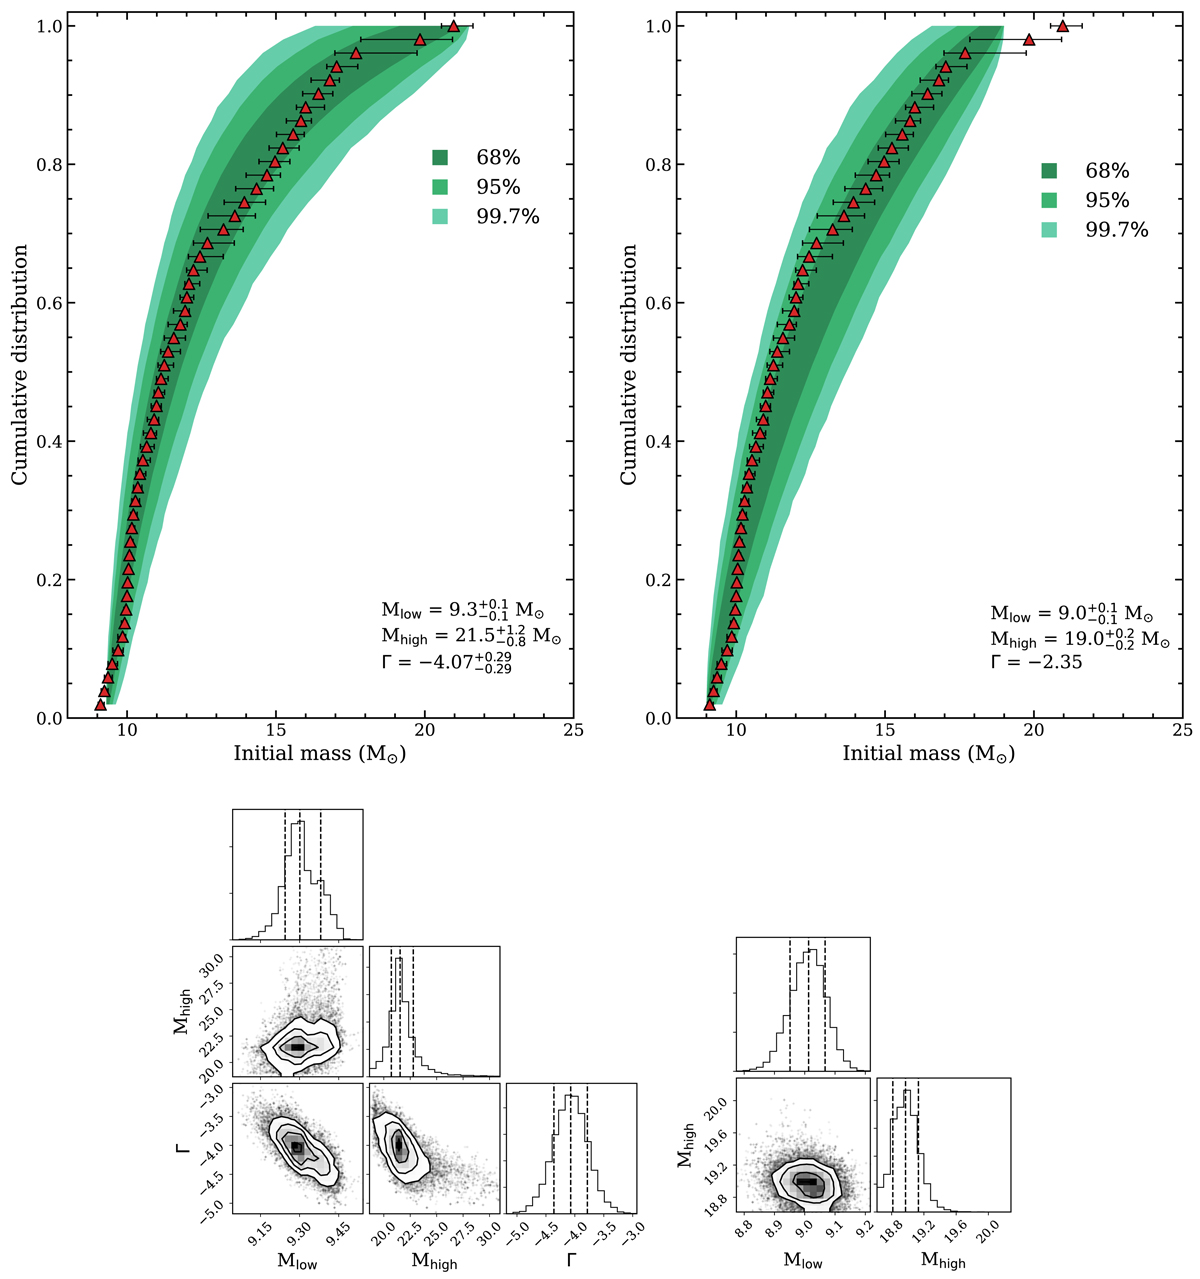
Fig. 8.
Download original image
Fits to the CD of MZAMS of SN II progenitors in the full sample. Top left: CD of MZAMS derived in our work for the full sample (red triangles and the error bars), corresponding to the median and the 68% confidence limit of the distribution presented in Fig. 5 as shaded contours, in comparison with the model CD constructed with the median values of the marginal distributions of the parameters (shaded contours). Bottom left: corner plot of the joint posterior probability distribution of the parameters. Dashed lines indicate the 16th, 50th, and 84th percentiles of the distributions. The right panels show the same as the left panels but when the power-law slope is fixed to Γ = −2.35.
Current usage metrics show cumulative count of Article Views (full-text article views including HTML views, PDF and ePub downloads, according to the available data) and Abstracts Views on Vision4Press platform.
Data correspond to usage on the plateform after 2015. The current usage metrics is available 48-96 hours after online publication and is updated daily on week days.
Initial download of the metrics may take a while.