Fig. 9.
Download original image
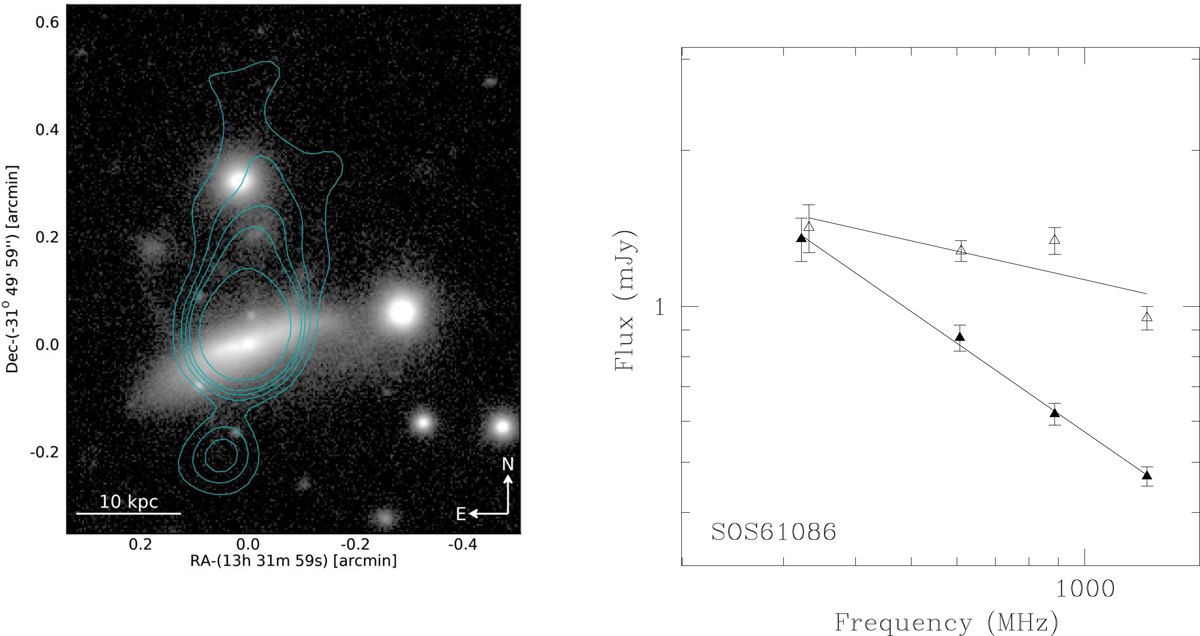
ESO-VST r-band image of the field including SOS 61086 with 1.28 GHz MeerKAT radio contours superposed (left panel). The restoring beam of the radio image is 6.9″ × 6.5″, p.a. 151.8°. The contours are plotted at 20, 40, 60, 160 μJy beam−1. The first contour is drawn at ∼3.5σ (the local noise is ∼6 μJy beam−1). The scales (RA and Dec) give the distance (in arcsec) from the photometric centre of the galaxy. Spectrum of the radio emission of SOS 61086 (right panel). Open and filled triangles are the emission from the galaxy and the tail, respectively.
Current usage metrics show cumulative count of Article Views (full-text article views including HTML views, PDF and ePub downloads, according to the available data) and Abstracts Views on Vision4Press platform.
Data correspond to usage on the plateform after 2015. The current usage metrics is available 48-96 hours after online publication and is updated daily on week days.
Initial download of the metrics may take a while.