Fig. 8.
Download original image
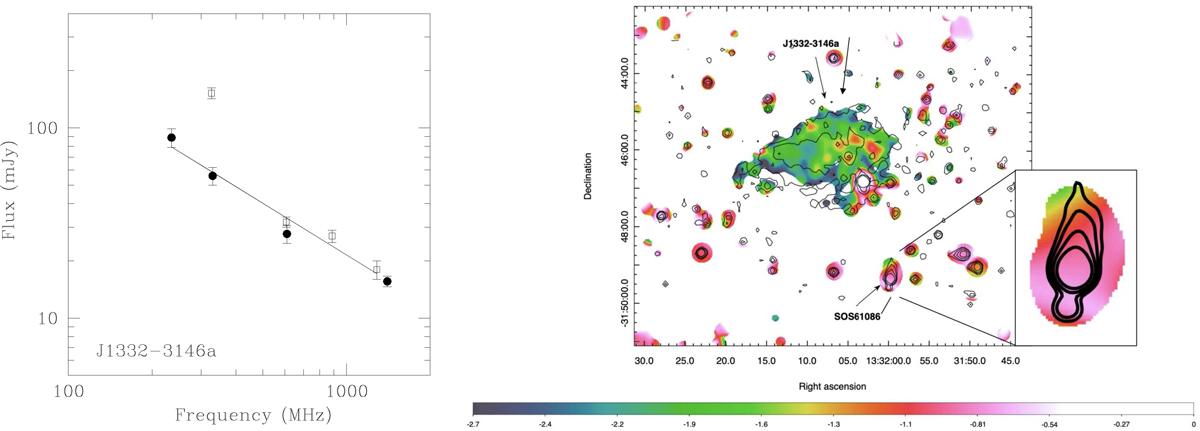
Radio spectrum of the radio source J1332–3146a, obtained using the data in Table 5 (left panel). Filled dots are from G05, open squares are from the present paper. The fit does not include the 306 MHz measurement (see Sect. 4.3). In-band MeerKAT spectral image at the resolution of 15″ × 15″ (right panel). The radio contours are from the full resolution image, i.e. 7.3″ × 7.2″, and are drawn at ±20, 40, 80, and 160 μJy beam−1. A zoom of the radio source associated with SOS 61086 is shown in the inset.
Current usage metrics show cumulative count of Article Views (full-text article views including HTML views, PDF and ePub downloads, according to the available data) and Abstracts Views on Vision4Press platform.
Data correspond to usage on the plateform after 2015. The current usage metrics is available 48-96 hours after online publication and is updated daily on week days.
Initial download of the metrics may take a while.