Fig. 4.
Download original image
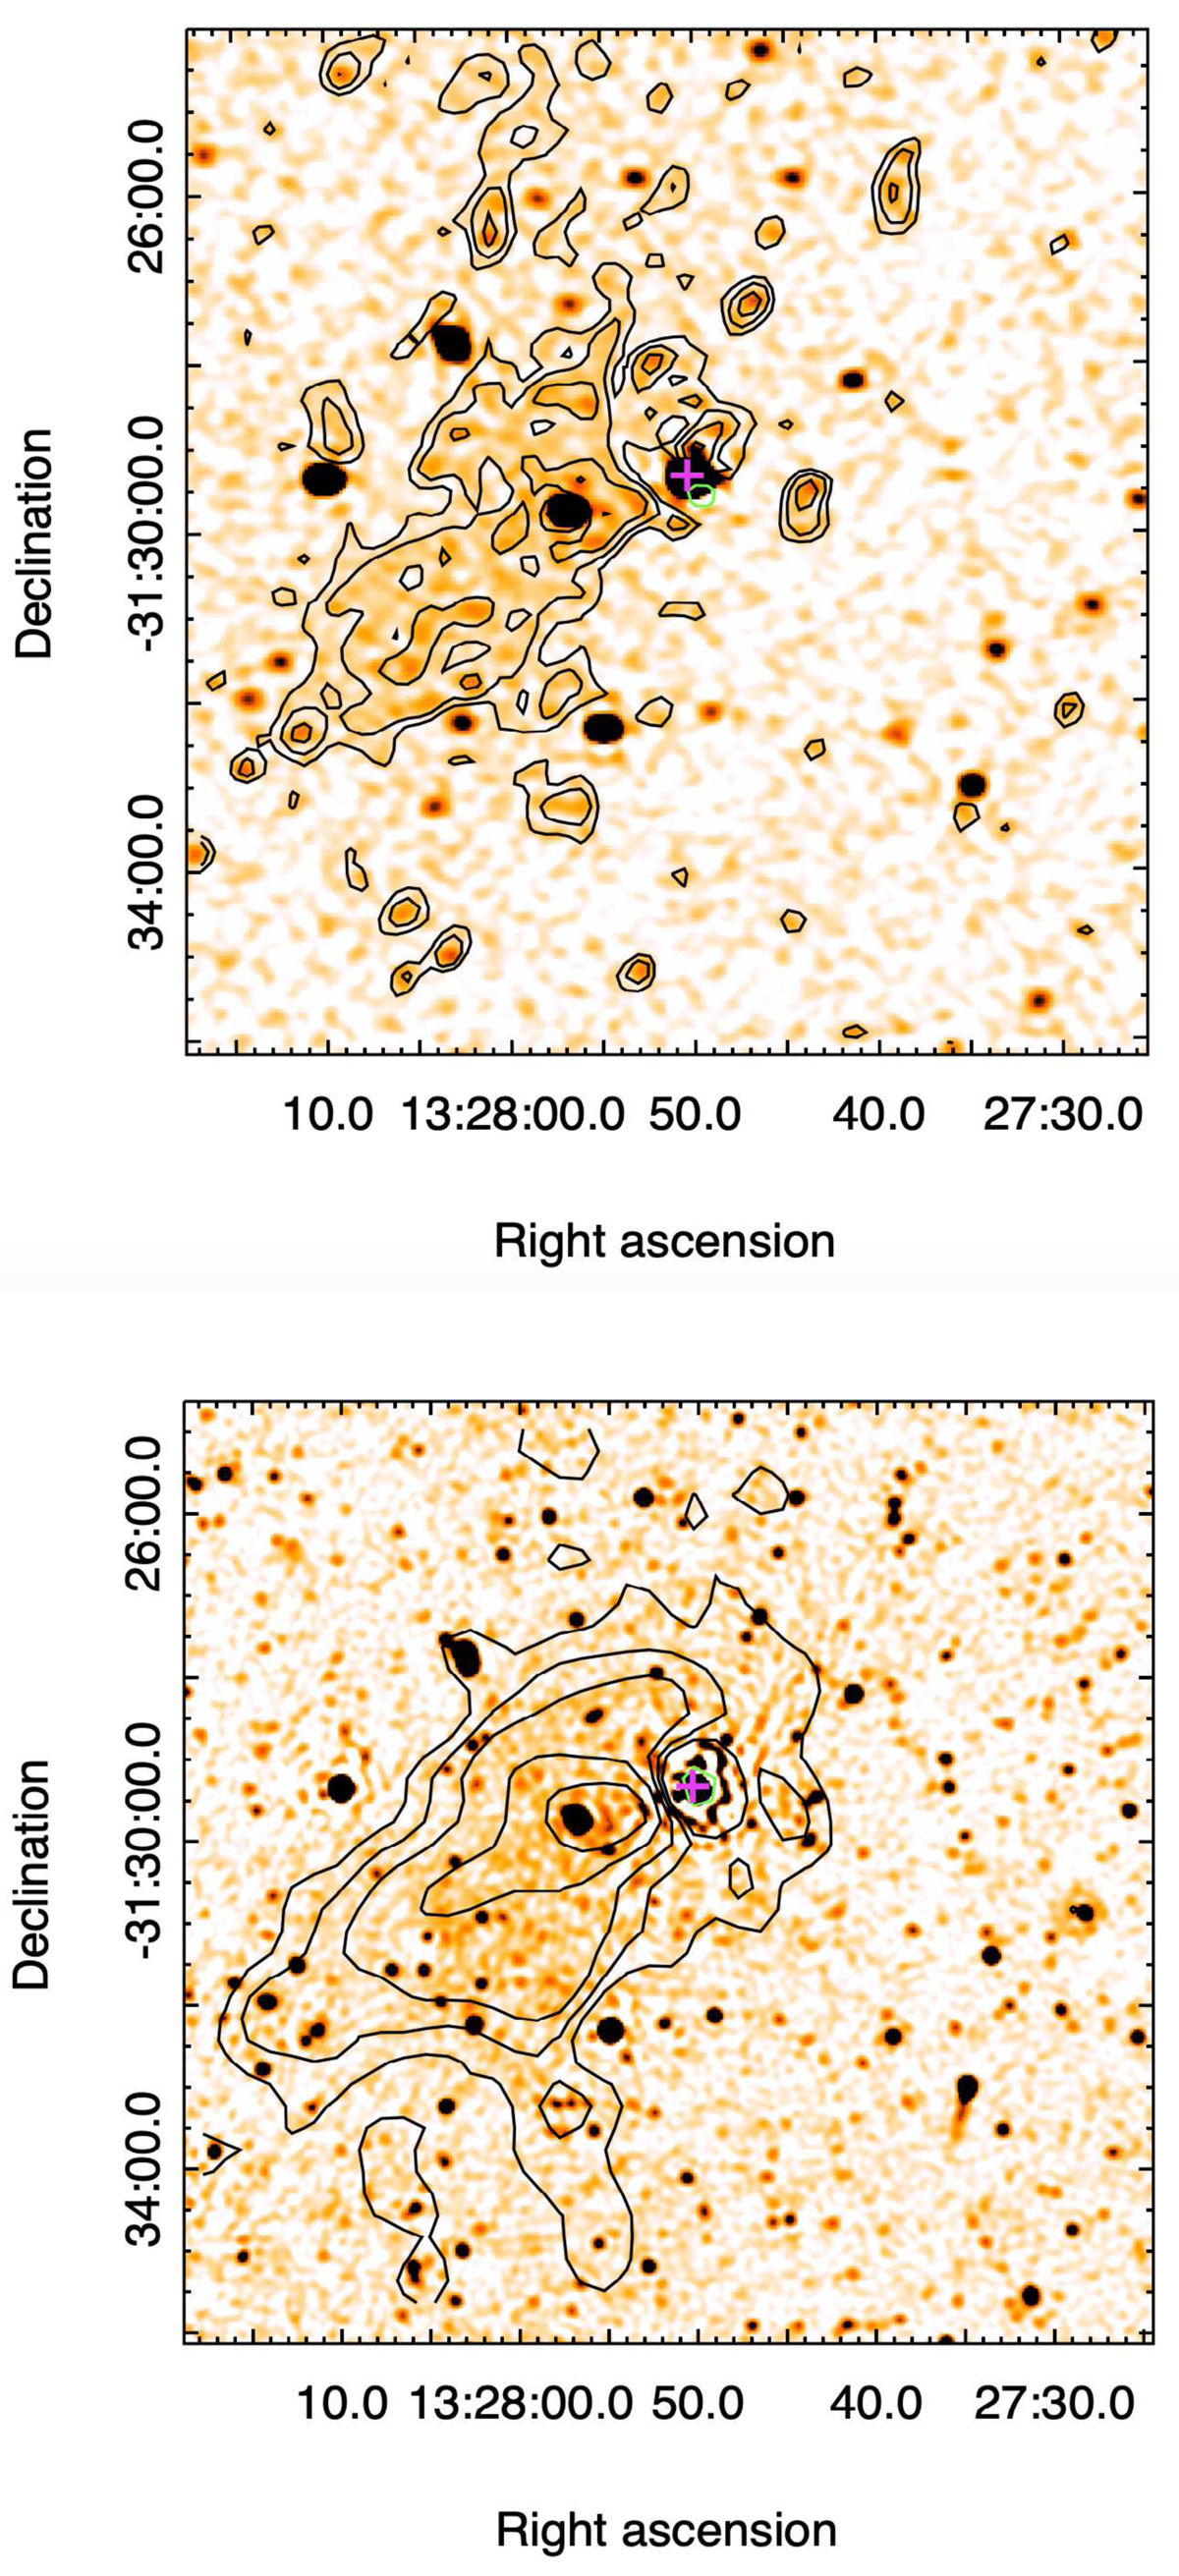
Radio halo in A3558. In both panels the magenta cross shows the position of the brightest cluster galaxy (BCG). Upper panel: ASKAP image at 887 MHz in colour (same resolution and rms as in the upper panel of Fig. 3). The black contours show the emission of the halo after subtraction of the embedded point sources (see Sect. 4.7). The resolutions is 25.1″ × 20.9″, in p.a. 131.5° and the rms is ∼35 μJy beam−1. Contour levels start at ±0.15 mJy beam−1 and are spaced by ![]() (negative contours in green). Lower panel: MeerKAT image at 1.283 GHz in colour (same resolution and rms as in the central panel of Fig. 3). The black contours show the emission after subtraction of the point sources (see Sect. 4.7) convolved with a restoring beam of 40.9″ × 40.4″, in p.a. 144.6°. The rms is ∼35 μJy beam−1. Contour levels start at ±0.125 mJy beam−1 and are spaced by
(negative contours in green). Lower panel: MeerKAT image at 1.283 GHz in colour (same resolution and rms as in the central panel of Fig. 3). The black contours show the emission after subtraction of the point sources (see Sect. 4.7) convolved with a restoring beam of 40.9″ × 40.4″, in p.a. 144.6°. The rms is ∼35 μJy beam−1. Contour levels start at ±0.125 mJy beam−1 and are spaced by ![]() (negative contours in green).
(negative contours in green).
Current usage metrics show cumulative count of Article Views (full-text article views including HTML views, PDF and ePub downloads, according to the available data) and Abstracts Views on Vision4Press platform.
Data correspond to usage on the plateform after 2015. The current usage metrics is available 48-96 hours after online publication and is updated daily on week days.
Initial download of the metrics may take a while.