Free Access
Fig. 16.
Download original image
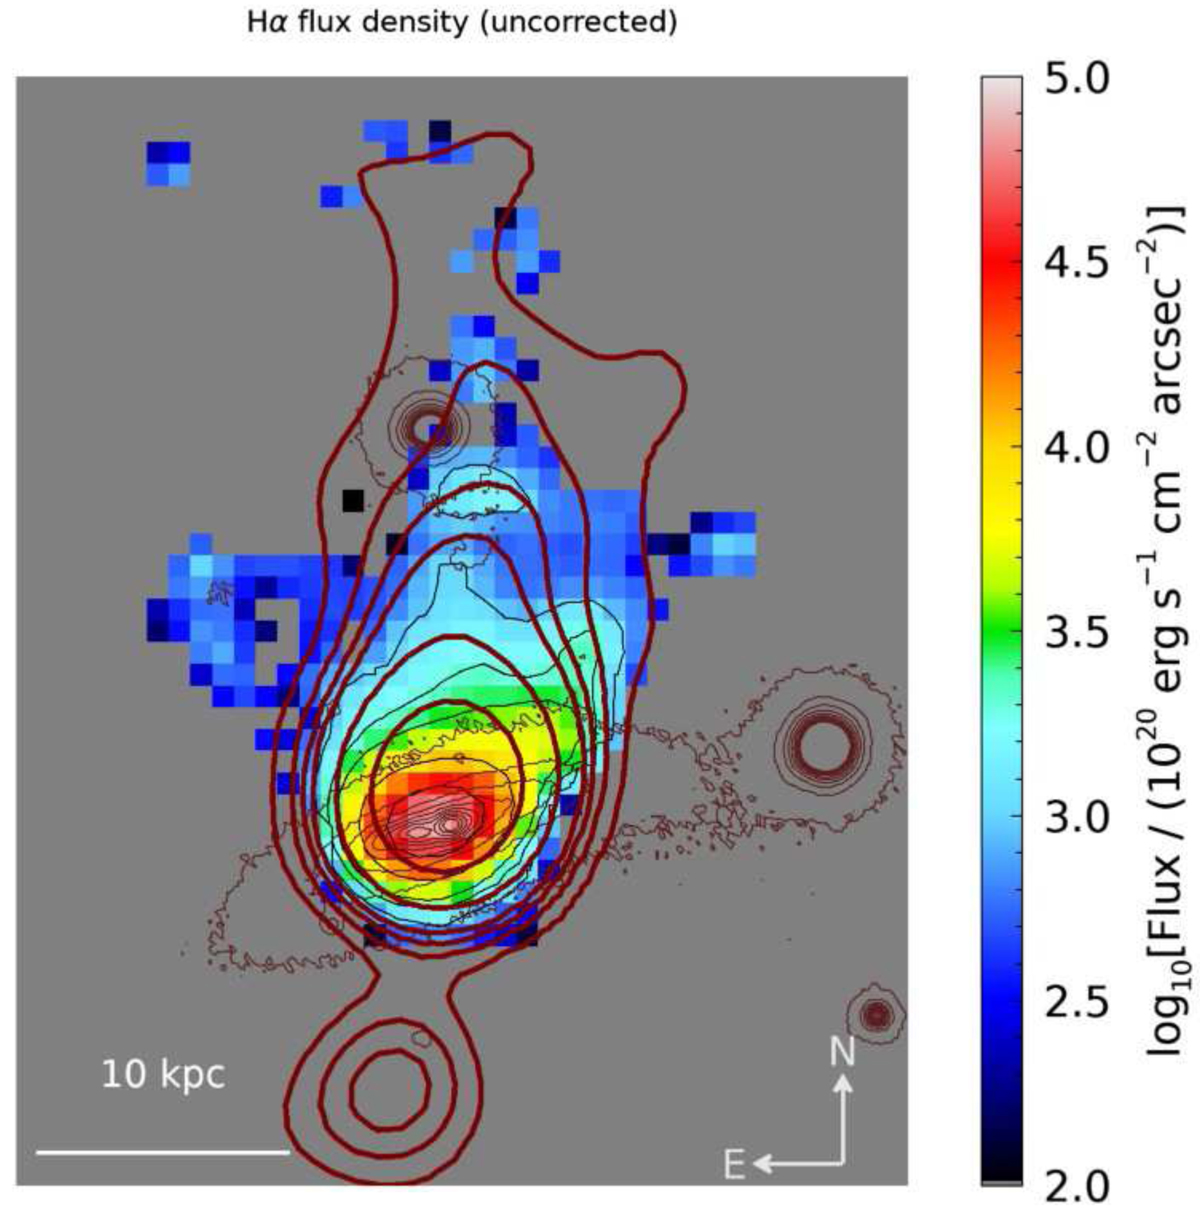
Hα flux for SOS 61086 derived from IFS data. The r-band contours and the MeerKAT radio contours (same as Fig. 9, left panel) are shown in thin and thick red lines, respectively.
Current usage metrics show cumulative count of Article Views (full-text article views including HTML views, PDF and ePub downloads, according to the available data) and Abstracts Views on Vision4Press platform.
Data correspond to usage on the plateform after 2015. The current usage metrics is available 48-96 hours after online publication and is updated daily on week days.
Initial download of the metrics may take a while.