Fig. 14.
Download original image
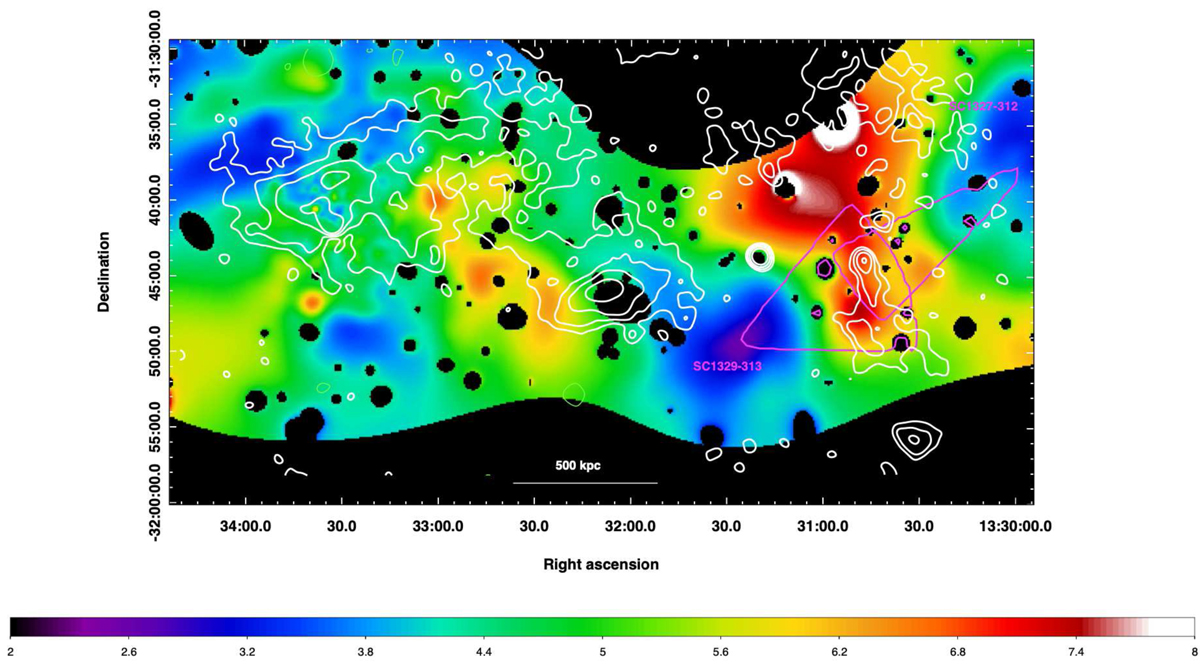
[0.3, 12]-keV XMM-Newton temperature map (in colour) computed from wavelet spectral-imaging (see Sect. 3.4). Contours of the MeerKAT 1.28 GHz image at the resolution of 40″ × 40″ (same as bottom panel of Fig. 3) are overlaid in white. The contours are drawn at ±0.1, 0.2, 0.4, 0.8 mJy beam−1. The average rms in the image is ∼30 μJy beam−1. The black areas are the subtracted individual sources. The magenta sectors show the regions of extraction of the temperature profiles in SC 1327–312 and SC 1329–313 (Sect. 5.2 and Fig. 15).
Current usage metrics show cumulative count of Article Views (full-text article views including HTML views, PDF and ePub downloads, according to the available data) and Abstracts Views on Vision4Press platform.
Data correspond to usage on the plateform after 2015. The current usage metrics is available 48-96 hours after online publication and is updated daily on week days.
Initial download of the metrics may take a while.