Free Access
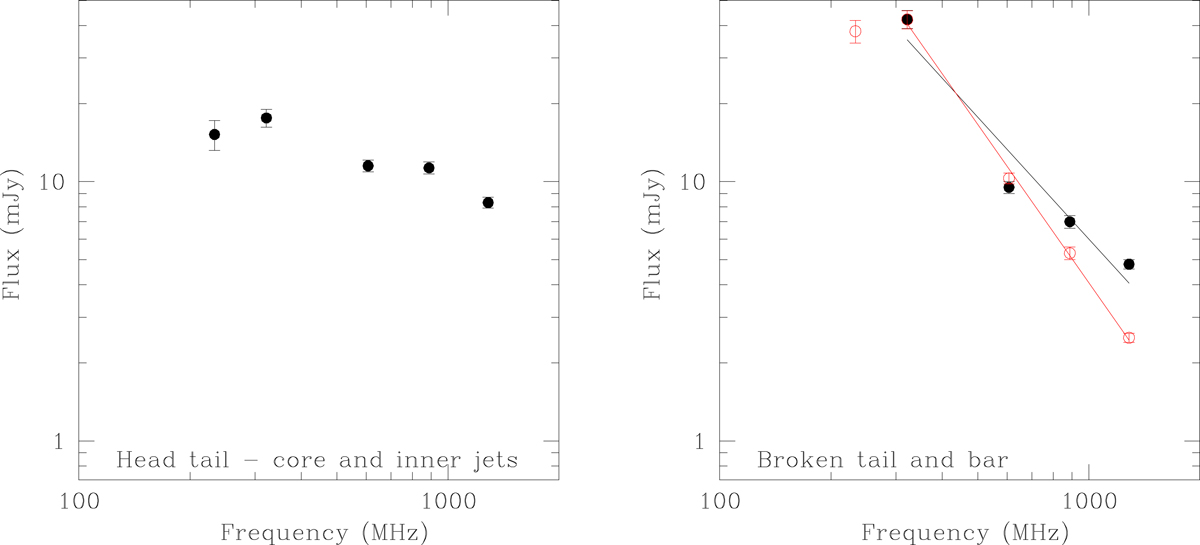
Fig. 11.
Download original image
Spectra of the components in the head–tail radio galaxy. Left panel: core region, encompassing the core and the inner tail (red area in the left panel of Fig. 10). Right panel: broken tail (black filled circles) and bar (red open circles).
Current usage metrics show cumulative count of Article Views (full-text article views including HTML views, PDF and ePub downloads, according to the available data) and Abstracts Views on Vision4Press platform.
Data correspond to usage on the plateform after 2015. The current usage metrics is available 48-96 hours after online publication and is updated daily on week days.
Initial download of the metrics may take a while.