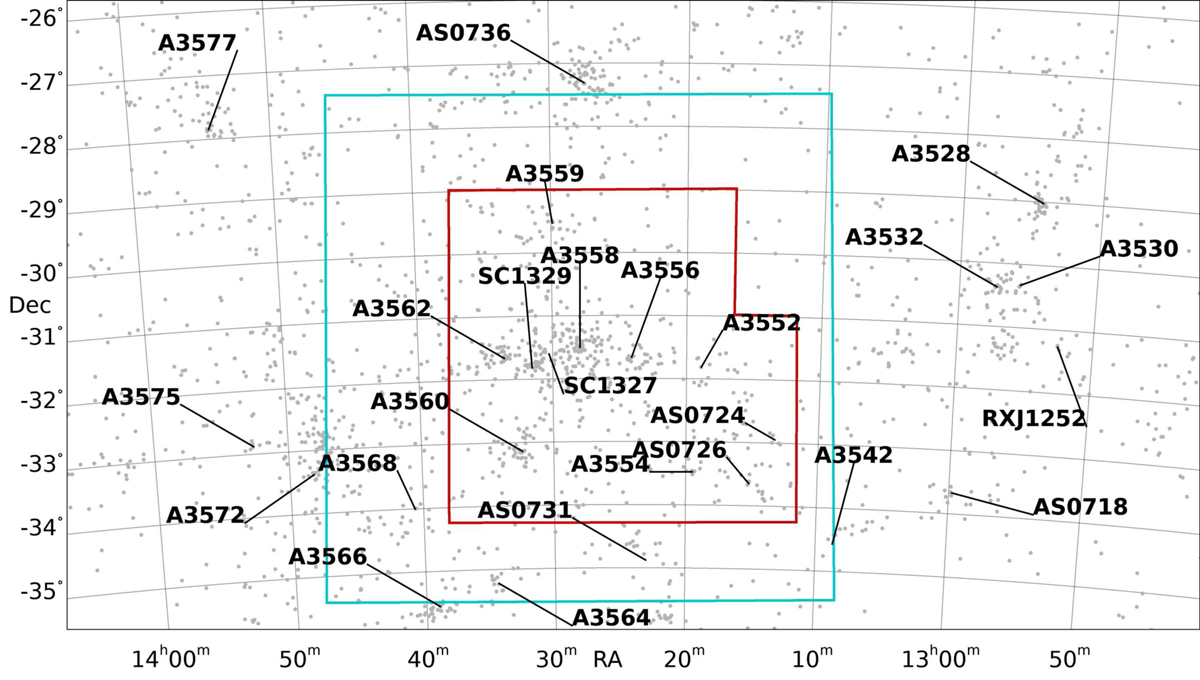
Fig. 1.
Download original image
Location of the clusters and groups in the Shapley Supercluster. The redshift information is from the 6dF Galaxy Survey (6dFGS, Jones et al. 2009). The redshift range considered is 0.035−0.060. The cyan lines highlight the area covered by the ASKAP observations (Sect. 3.1), the red lines highlight the coverage of the ESO-VST optical imaging of ShaSS (Merluzzi et al. 2015).
Current usage metrics show cumulative count of Article Views (full-text article views including HTML views, PDF and ePub downloads, according to the available data) and Abstracts Views on Vision4Press platform.
Data correspond to usage on the plateform after 2015. The current usage metrics is available 48-96 hours after online publication and is updated daily on week days.
Initial download of the metrics may take a while.