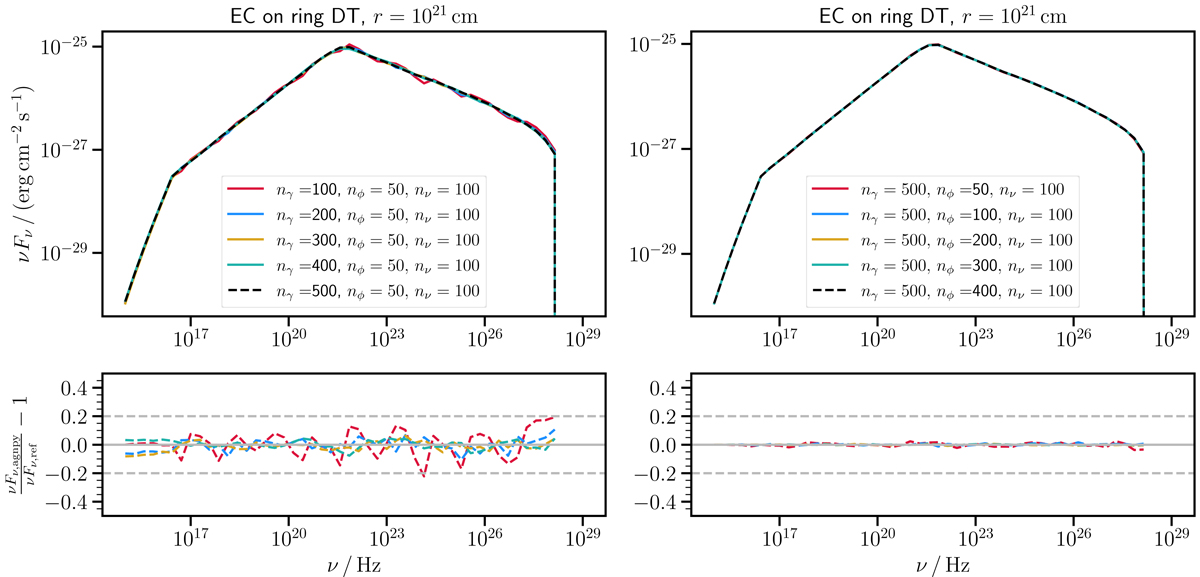
Fig. C.1.
Download original image
Effect of the resolution of the integration grid on the final spectrum. Left: variation of the number of points along the EED energy dimension, nγ. Right: variation of the number of points along the azimuth angle dimension, nϕ. In both bottom panels the deviation of the individual SEDs from the one with the denser integration grid (drawn with a dashed black line in the upper panel) is plotted.
Current usage metrics show cumulative count of Article Views (full-text article views including HTML views, PDF and ePub downloads, according to the available data) and Abstracts Views on Vision4Press platform.
Data correspond to usage on the plateform after 2015. The current usage metrics is available 48-96 hours after online publication and is updated daily on week days.
Initial download of the metrics may take a while.