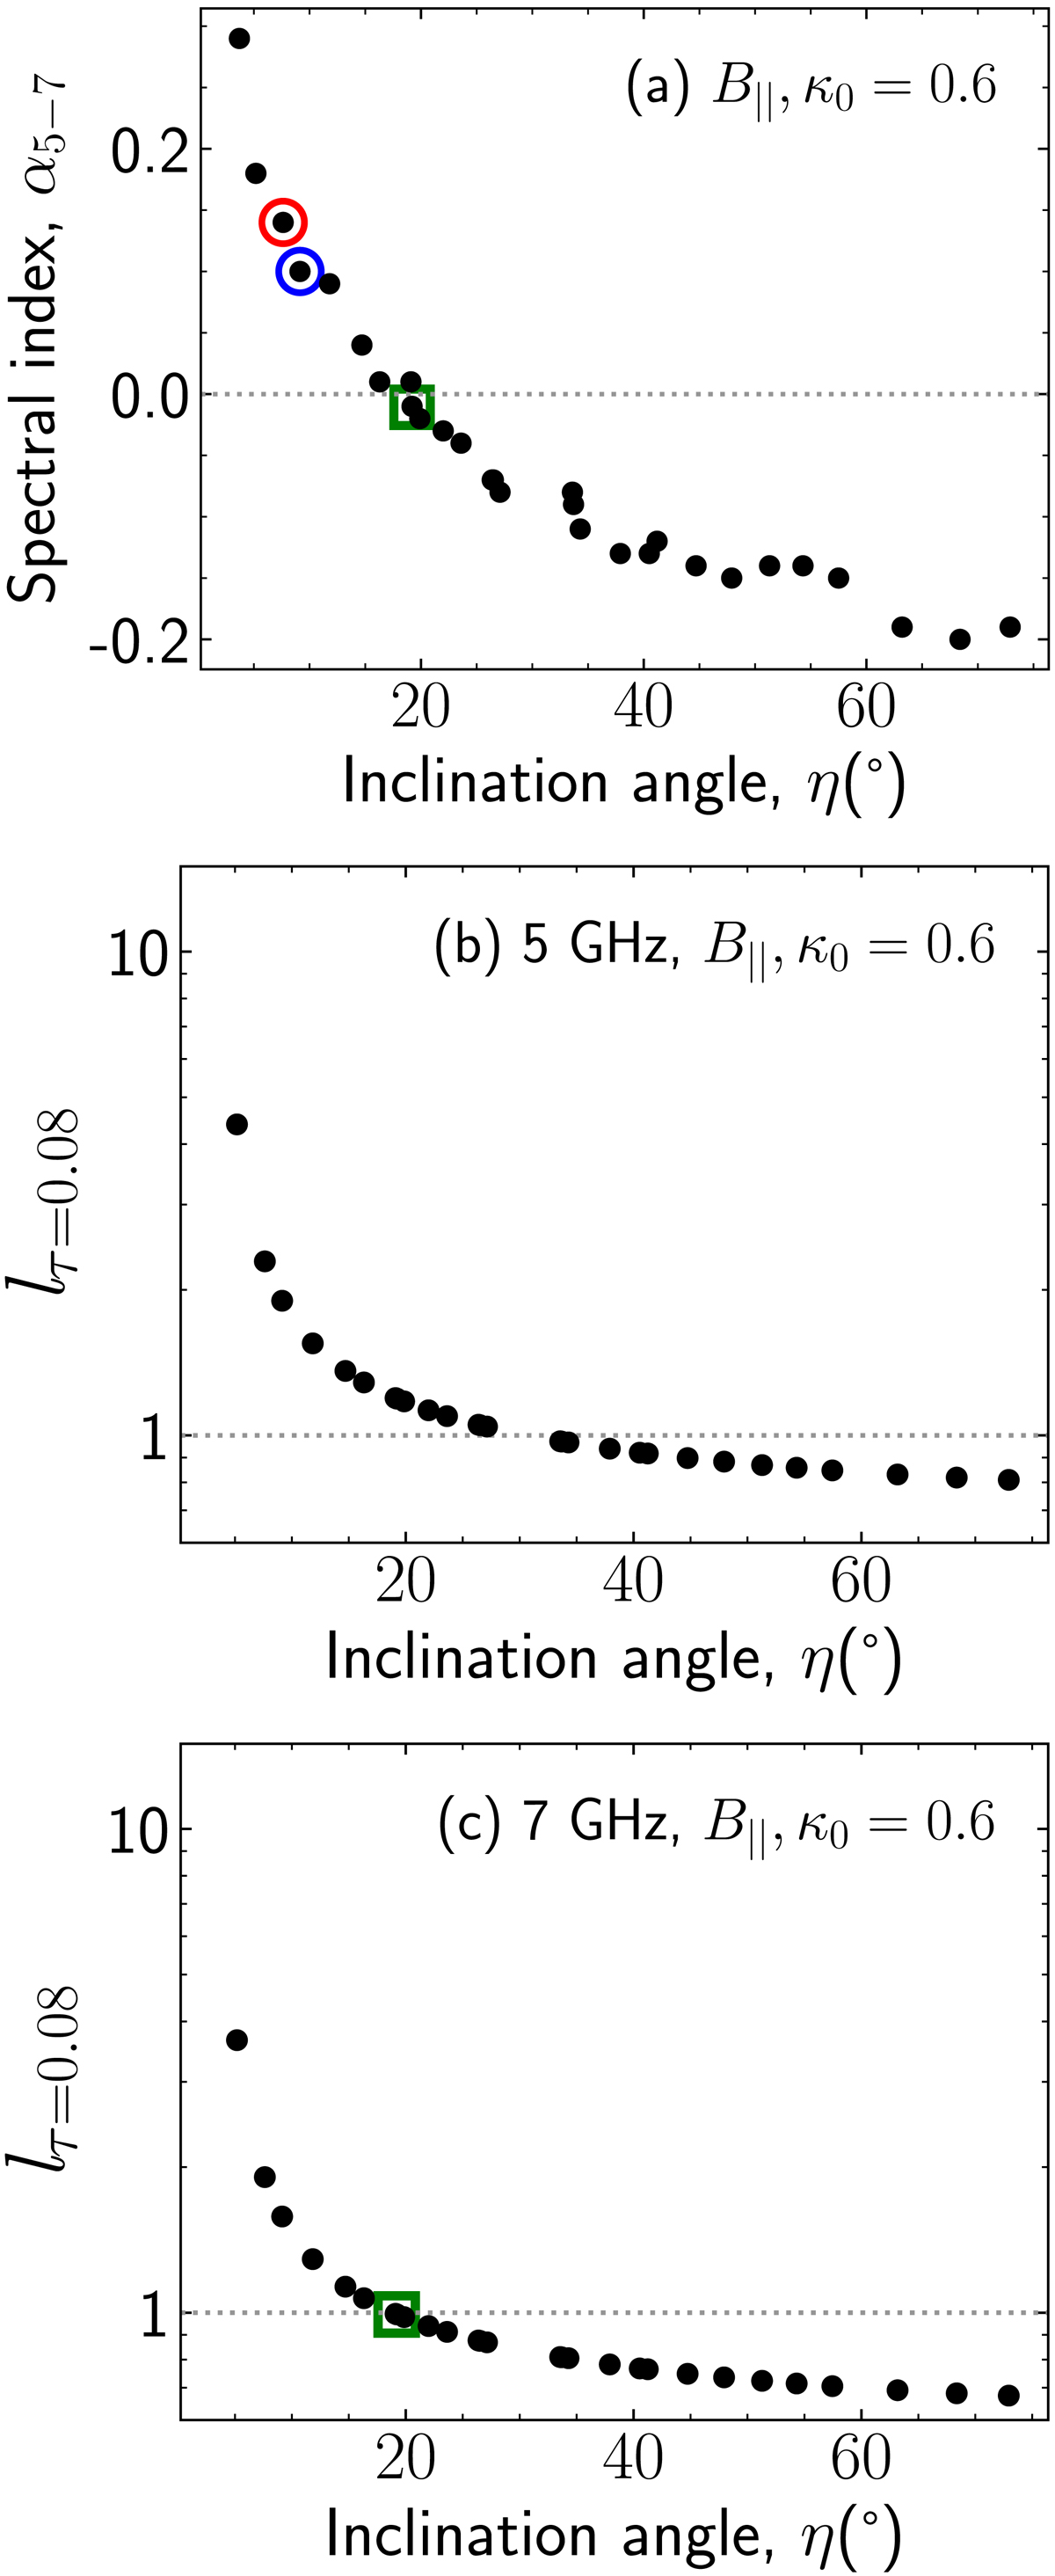
Fig. 9.
Download original image
(a) Spectral index between 5 GHz and 7 GHz as a function of the inclination angle for κ0 = 0.6. The green square represents the angle where the emission becomes optically thin. Red and blue circles are the same as in Figs. 5 and 6. (b),(c) Positions of the jet surface where optical depth τ = 0.08 for 5 GHz and 7 GHz, respectively, with κ0 = 0.6. lτ = 0.08 = 1 represents the position on the jet after which the emission becomes optically thin all along the jet, i.e., when τ ≪ 1.
Current usage metrics show cumulative count of Article Views (full-text article views including HTML views, PDF and ePub downloads, according to the available data) and Abstracts Views on Vision4Press platform.
Data correspond to usage on the plateform after 2015. The current usage metrics is available 48-96 hours after online publication and is updated daily on week days.
Initial download of the metrics may take a while.