Open Access
Fig. 7.
Download original image
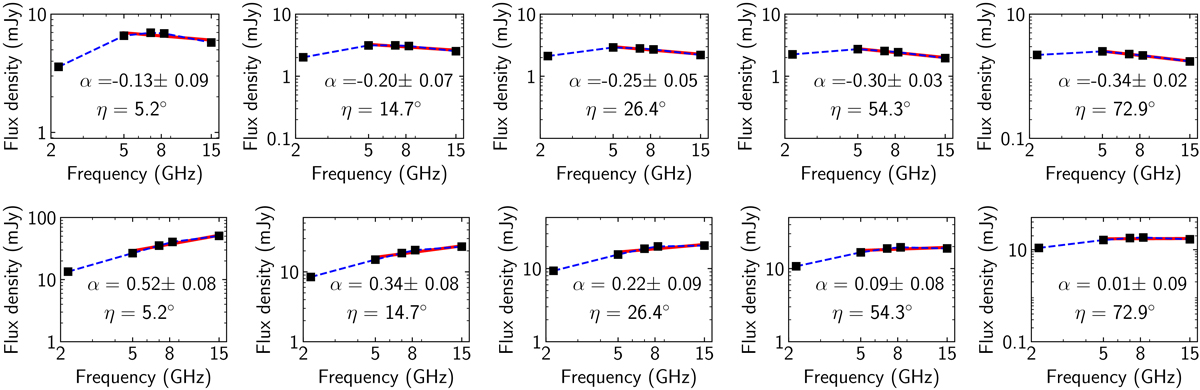
Flux as a function of frequency for different inclination angles for a parallel magnetic field configuration. Both axes are in log scale. The blue dashed lines connect the model data and the red lines show the spectral index fit. Top panel: with κ0 = 0.6.. Bottom panel: with κ0 = 6.
Current usage metrics show cumulative count of Article Views (full-text article views including HTML views, PDF and ePub downloads, according to the available data) and Abstracts Views on Vision4Press platform.
Data correspond to usage on the plateform after 2015. The current usage metrics is available 48-96 hours after online publication and is updated daily on week days.
Initial download of the metrics may take a while.