Fig. 6.
Download original image
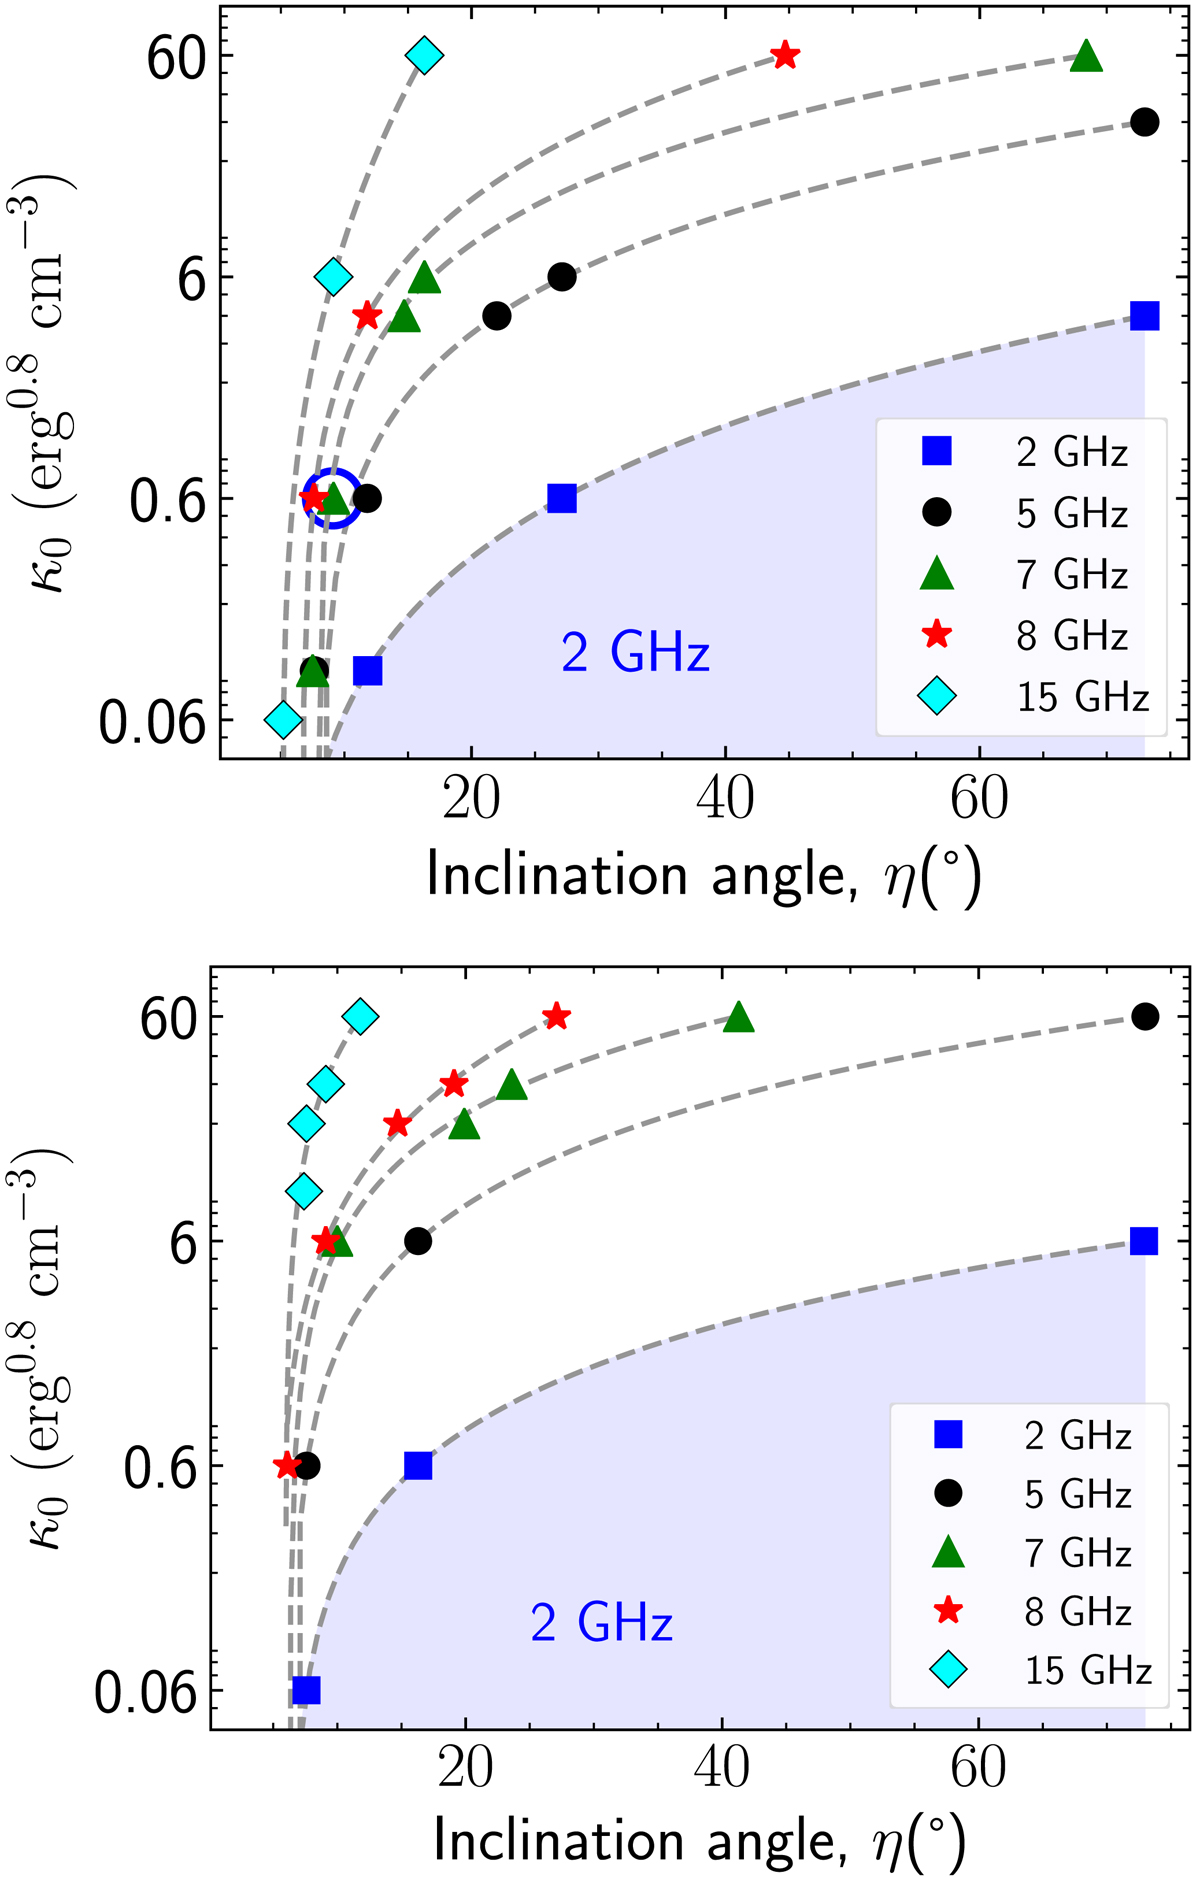
Last inclination angle in the (η, κ0)–plane where the core is still present in the conical jet for the given frequencies (2, 5, 7, 8, and 15 GHz), before moving below the base. The curve divides the (η, κ0)–plane into two distinct regions: presence of core along the conical jet, i.e. lτ = 1 ⩾ 1 (points on and area above the curve) and core moved below the base of the jet lτ = 1 < 1 (area under the curve) for a given frequency. As an example, here we trace the area under the curve for 2 GHz (blue shaded region). Y-axis is in log scale. Top and bottom panels show results for parallel and perpendicular magnetic field configurations, respectively.
Current usage metrics show cumulative count of Article Views (full-text article views including HTML views, PDF and ePub downloads, according to the available data) and Abstracts Views on Vision4Press platform.
Data correspond to usage on the plateform after 2015. The current usage metrics is available 48-96 hours after online publication and is updated daily on week days.
Initial download of the metrics may take a while.