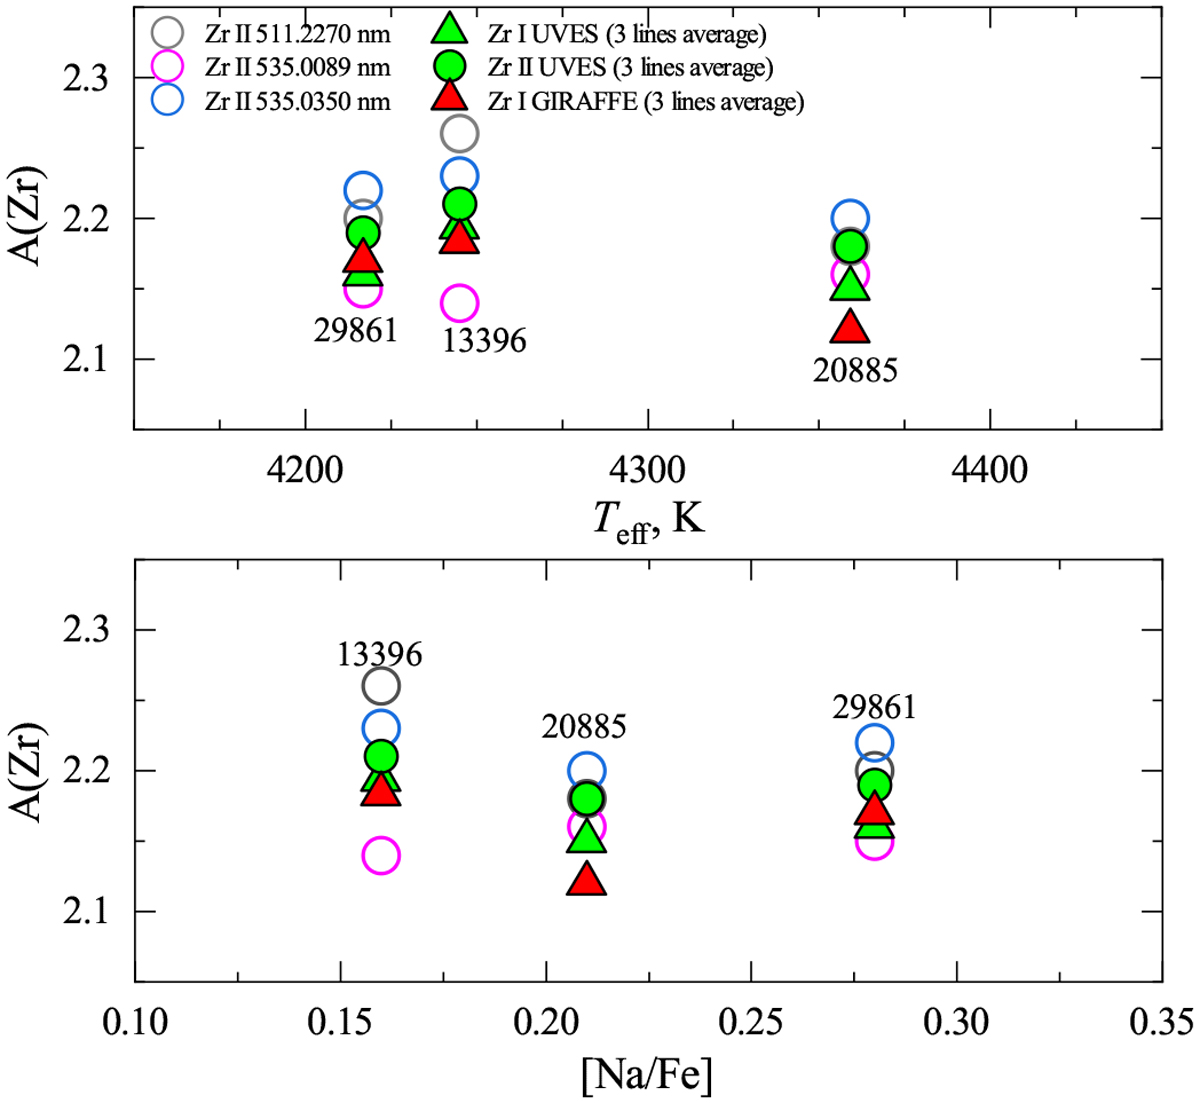
Fig. B.11
Download original image
Abundances of Zr in the three RGB stars common to the GIRAFFE (this study) and UVES samples (Thygesen et al. 2014) determined by us using Zr I and Zr II lines in the GIRAFFE and UVES spectra (Table B.3 and B.4, Sect. B.2.4) and plotted against the effective temperature (top) and [Na/Fe] ratio (bottom). The mean abundances obtained using Zr I lines in the GIRAFFE and UVES spectra are shown by solid red and green triangles, respectively, while the mean abundances obtained from Zr II lines are plotted as green circles; and abundances determined from individual Zr II lines in the UVES spectra are shown as hollow circles.
Current usage metrics show cumulative count of Article Views (full-text article views including HTML views, PDF and ePub downloads, according to the available data) and Abstracts Views on Vision4Press platform.
Data correspond to usage on the plateform after 2015. The current usage metrics is available 48-96 hours after online publication and is updated daily on week days.
Initial download of the metrics may take a while.