Fig. B.10
Download original image
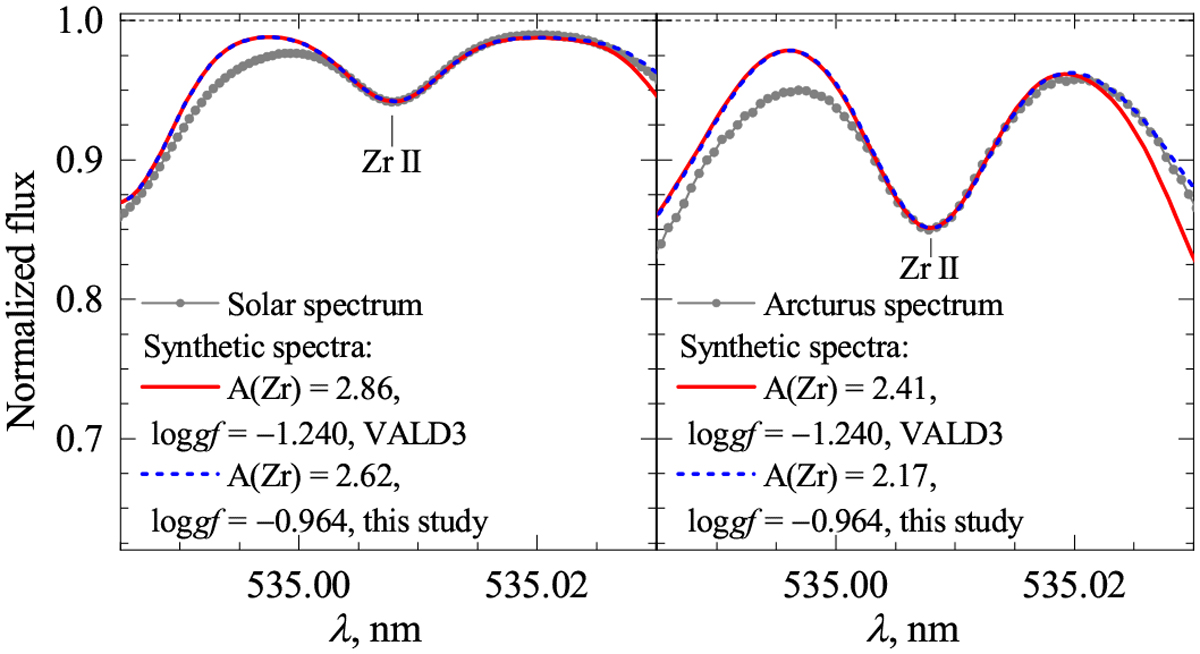
Left: Fit of the synthetic Zr II 535.0089 nm line to that observed in the solar spectrum from Kurucz (2005b). The red solid line shows the best fit obtained using the VALD3 oscillator strength, and the blue dashed line is the fit obtained using A(Zr) = 2.62 from Caffau etal. (2011b) and a modified oscillator strength (oscillator strengths and Zr abundances used/determined are indicated in the figure). For the line synthesis we used ?micro = 1.00 km s–1 and ?macro = 3.80 km s–1 from Doyle et al. (2014). Right: Best fit of the synthetic Zr II 535.0089 nm line to that observed in the spectrum of Arcturus from Hinkle et al. (2000). Spectral line synthesis was done using ?micro = 1.70 km s–1 and ftnacro = 5.20 km s–1 from Sheminova (2015).
Current usage metrics show cumulative count of Article Views (full-text article views including HTML views, PDF and ePub downloads, according to the available data) and Abstracts Views on Vision4Press platform.
Data correspond to usage on the plateform after 2015. The current usage metrics is available 48-96 hours after online publication and is updated daily on week days.
Initial download of the metrics may take a while.