Fig. B.9
Download original image
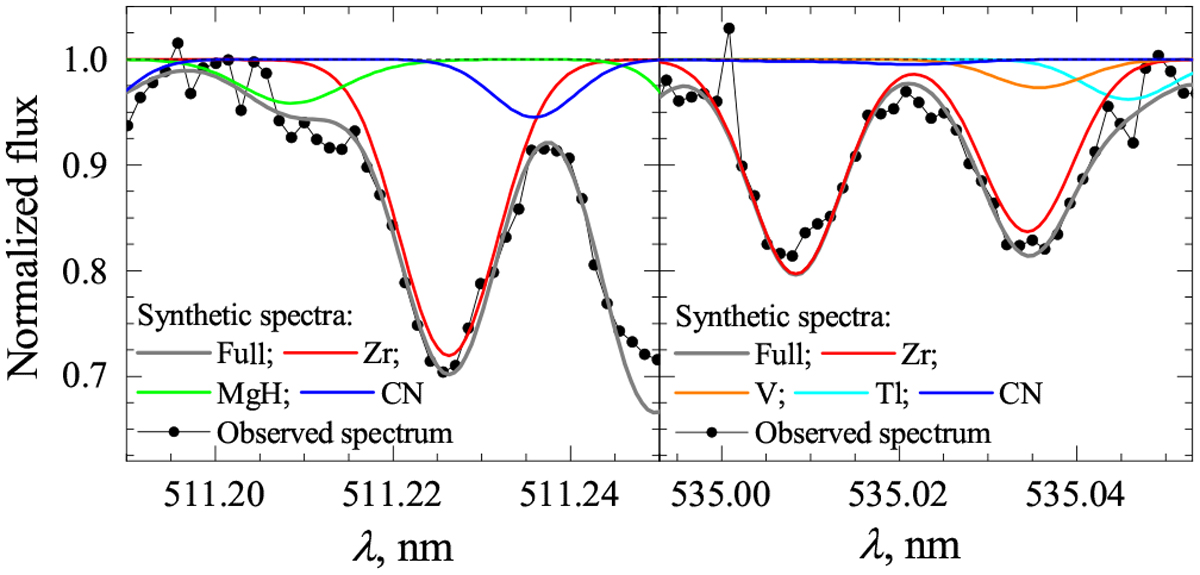
Zr II lines in the UVES spectrum of the target star 20885 (dots) overlaid with the synthetic spectrum (grey solid line) computed using the ATLAS9 model with Teff = 4359 K, log g = 1.41, [Fe/H] = -0.74, [Zr/Fe] = 0.30 dex, ?micro = 1.82 km s-1, ?macro = 3.00 km s-1 and solar-scaled elemental abundances (Grevesse & Sauval 1998). The left panel shows the vicinity of Zr II 511.2270nm line, the right panel that of 535.0089 nm and of 535.0350 nm Zr II lines. Other solid lines are synthetic profiles of individual lines, left panel: Zr II 511.2270nm (red line), MgH 511.2080 nm (green line), CN 511.2360 nm (blue line); right panel: Zr II 535.0089 nm and 535.0350 nm (red line), V II 535.0358 nm (orange line), Tl I 535.0456 nm (cyan line), CN 535.0215 nm (blue line).
Current usage metrics show cumulative count of Article Views (full-text article views including HTML views, PDF and ePub downloads, according to the available data) and Abstracts Views on Vision4Press platform.
Data correspond to usage on the plateform after 2015. The current usage metrics is available 48-96 hours after online publication and is updated daily on week days.
Initial download of the metrics may take a while.