Fig. 10
Download original image
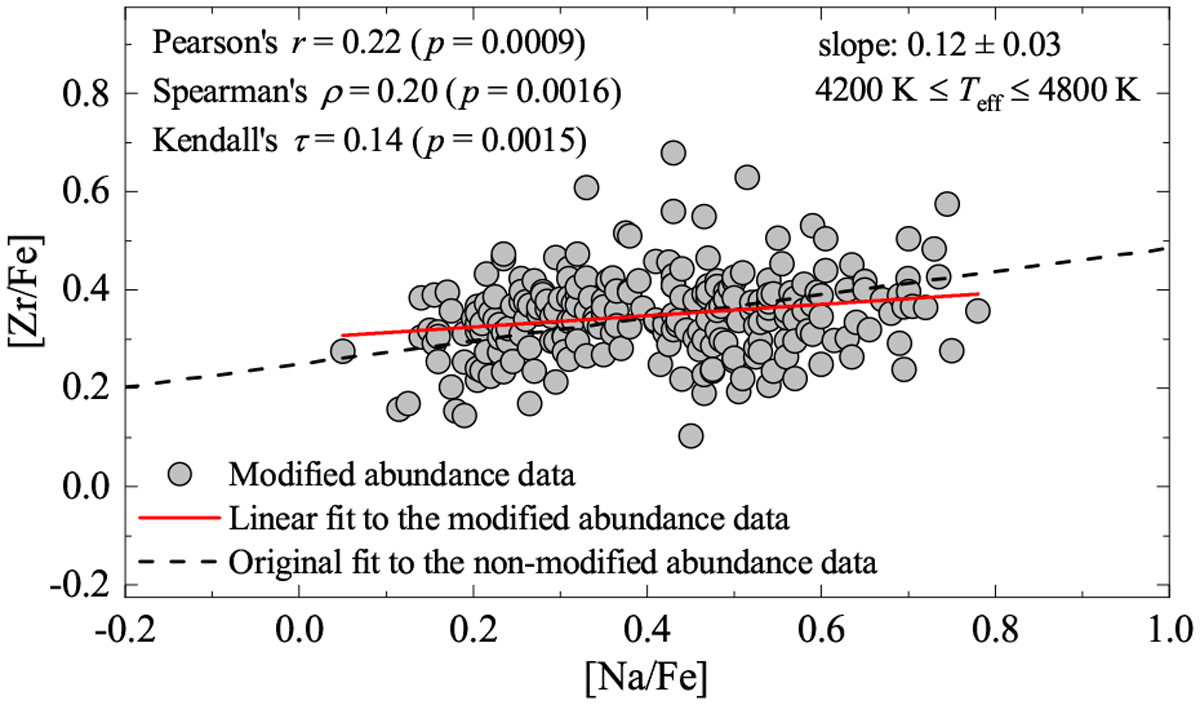
Influence of CN lines on the Zr–Na correlation. To account for the influence of CN blends, the original Zr abundances obtained from Zr I lines in Sect. 3.3.1 were modified by adding a correction which changed linearly from +0.04 dex at [Na/Fe] = 0.10 to −0.04 dex at [Na/Fe] = 0.75. A linear fit to the modified data (filled grey circles) is shown as a red solid line. The black dashed line is linear fit to the non-modified abundances in the [Zr/Fe] – [Na/Fe] plane shown in Fig. 5 (top panel) shifted to match the mean [Zr/Fe] value in the modified data at [Na/Fe] = 0.42.
Current usage metrics show cumulative count of Article Views (full-text article views including HTML views, PDF and ePub downloads, according to the available data) and Abstracts Views on Vision4Press platform.
Data correspond to usage on the plateform after 2015. The current usage metrics is available 48-96 hours after online publication and is updated daily on week days.
Initial download of the metrics may take a while.