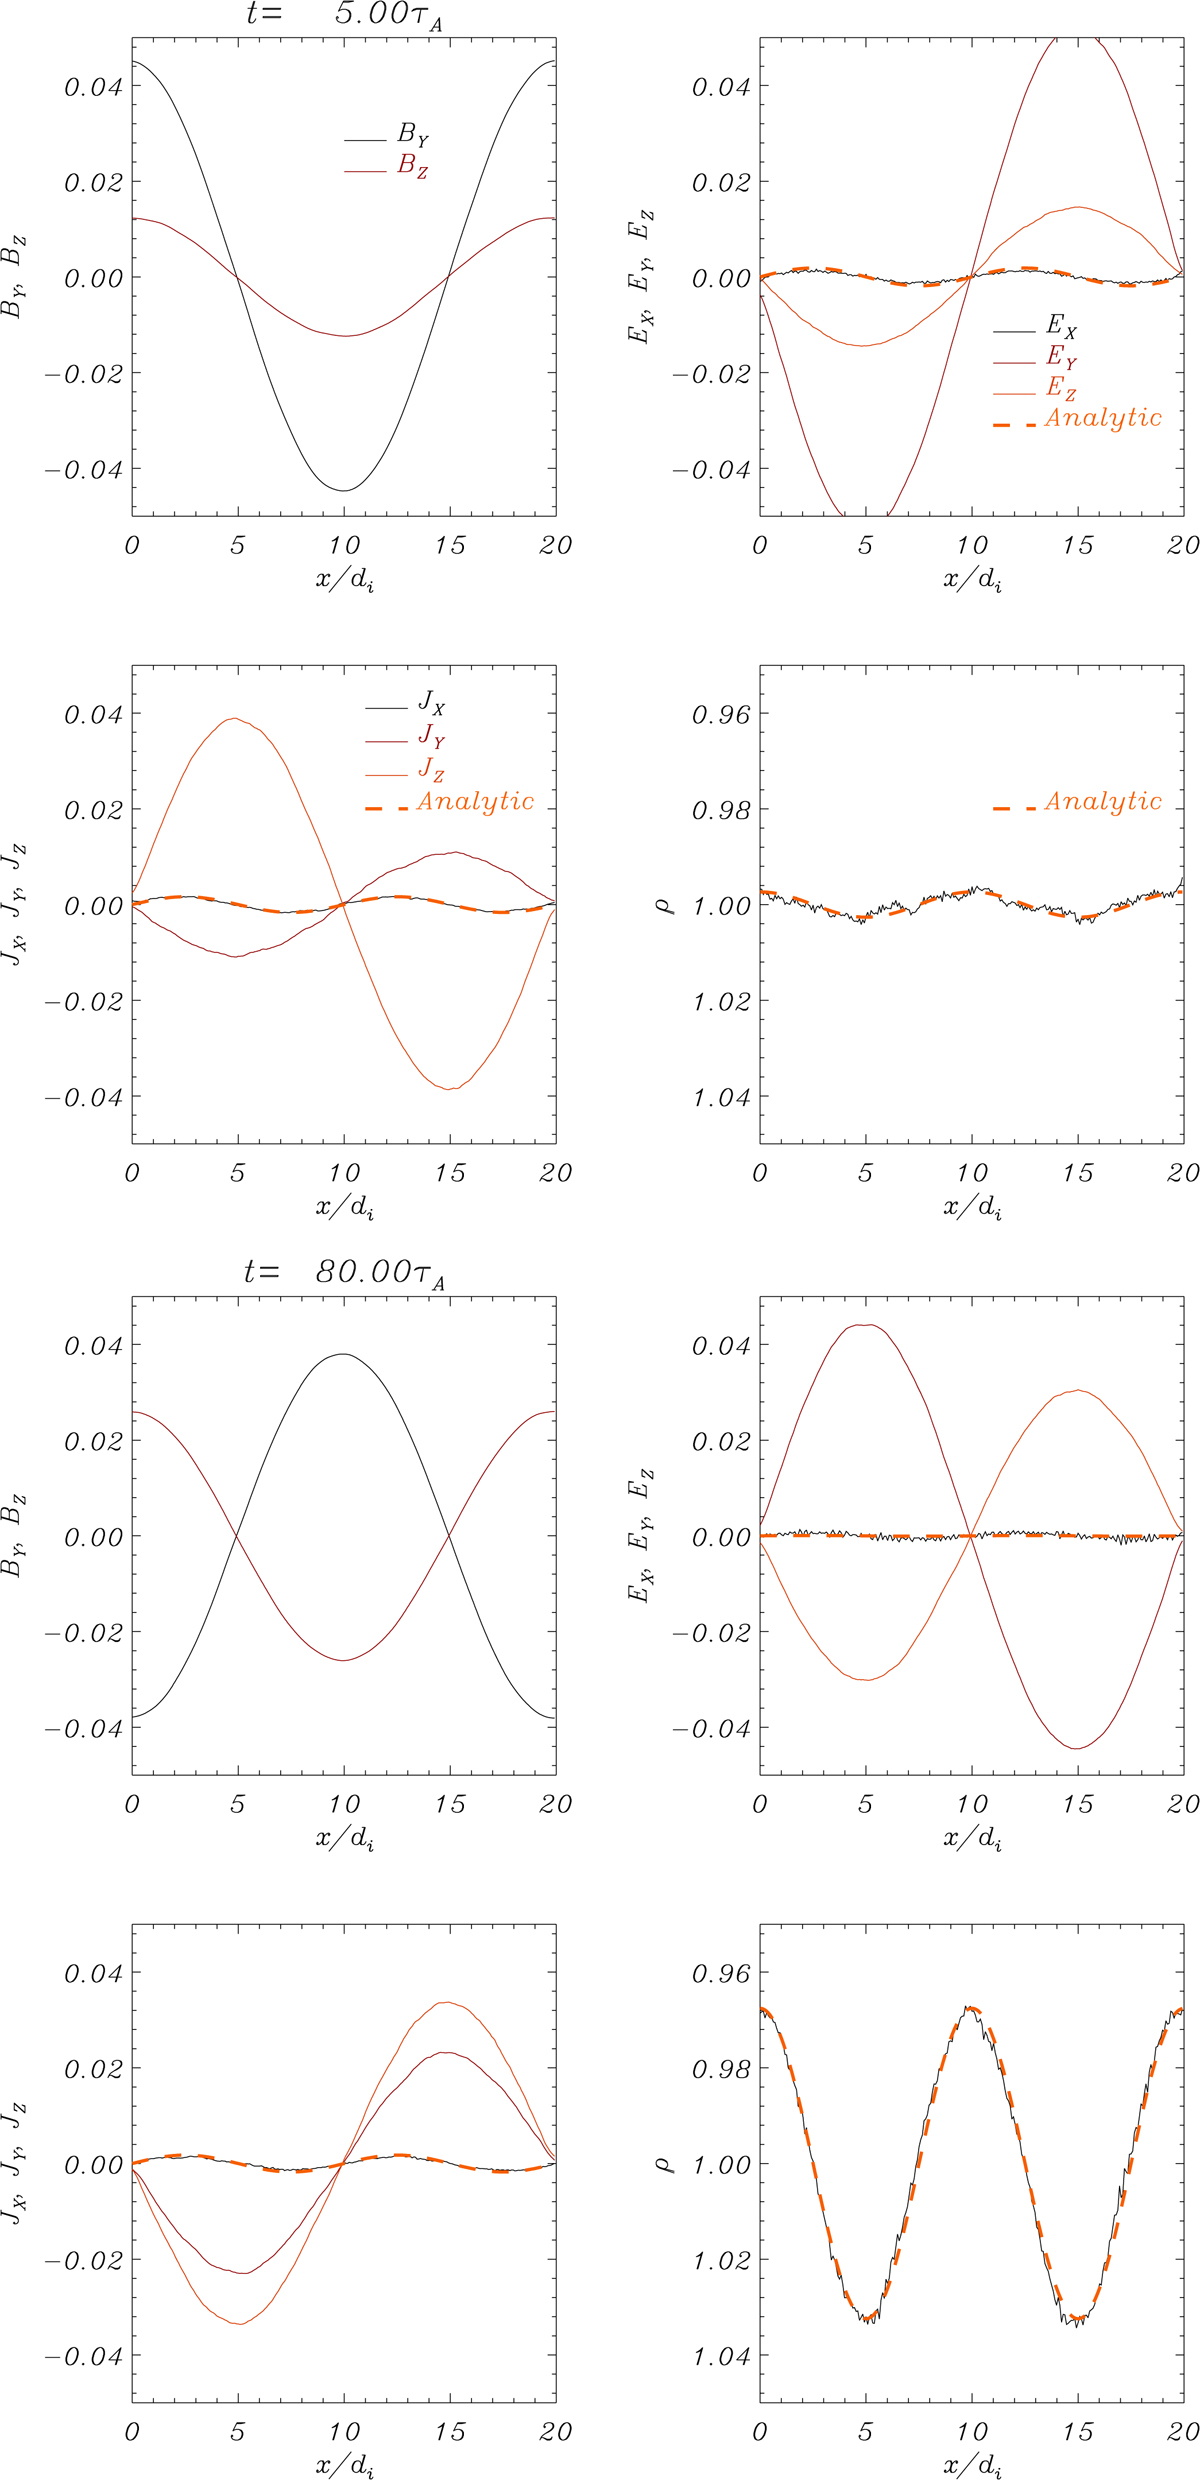
Fig. 8.
Download original image
Results from the numerical experiments. Top panel: macroscopic variables calculated from the hybrid simulations at t = 36.3τA. In this plot βe = 6 × 10⁻² and βp = 10−3 and k0 = 2π/L. Bottom panel: same as the previous panel, but at a later stage, t = 80τA. The thick orange lines correspond to the analytical predictions for the parallel electric field, velocity (essentially Jx), and density given by Eqs. (70)–(72); the match with the numerical results is quite significant. The temporal evolution is available as an online movie.
Current usage metrics show cumulative count of Article Views (full-text article views including HTML views, PDF and ePub downloads, according to the available data) and Abstracts Views on Vision4Press platform.
Data correspond to usage on the plateform after 2015. The current usage metrics is available 48-96 hours after online publication and is updated daily on week days.
Initial download of the metrics may take a while.