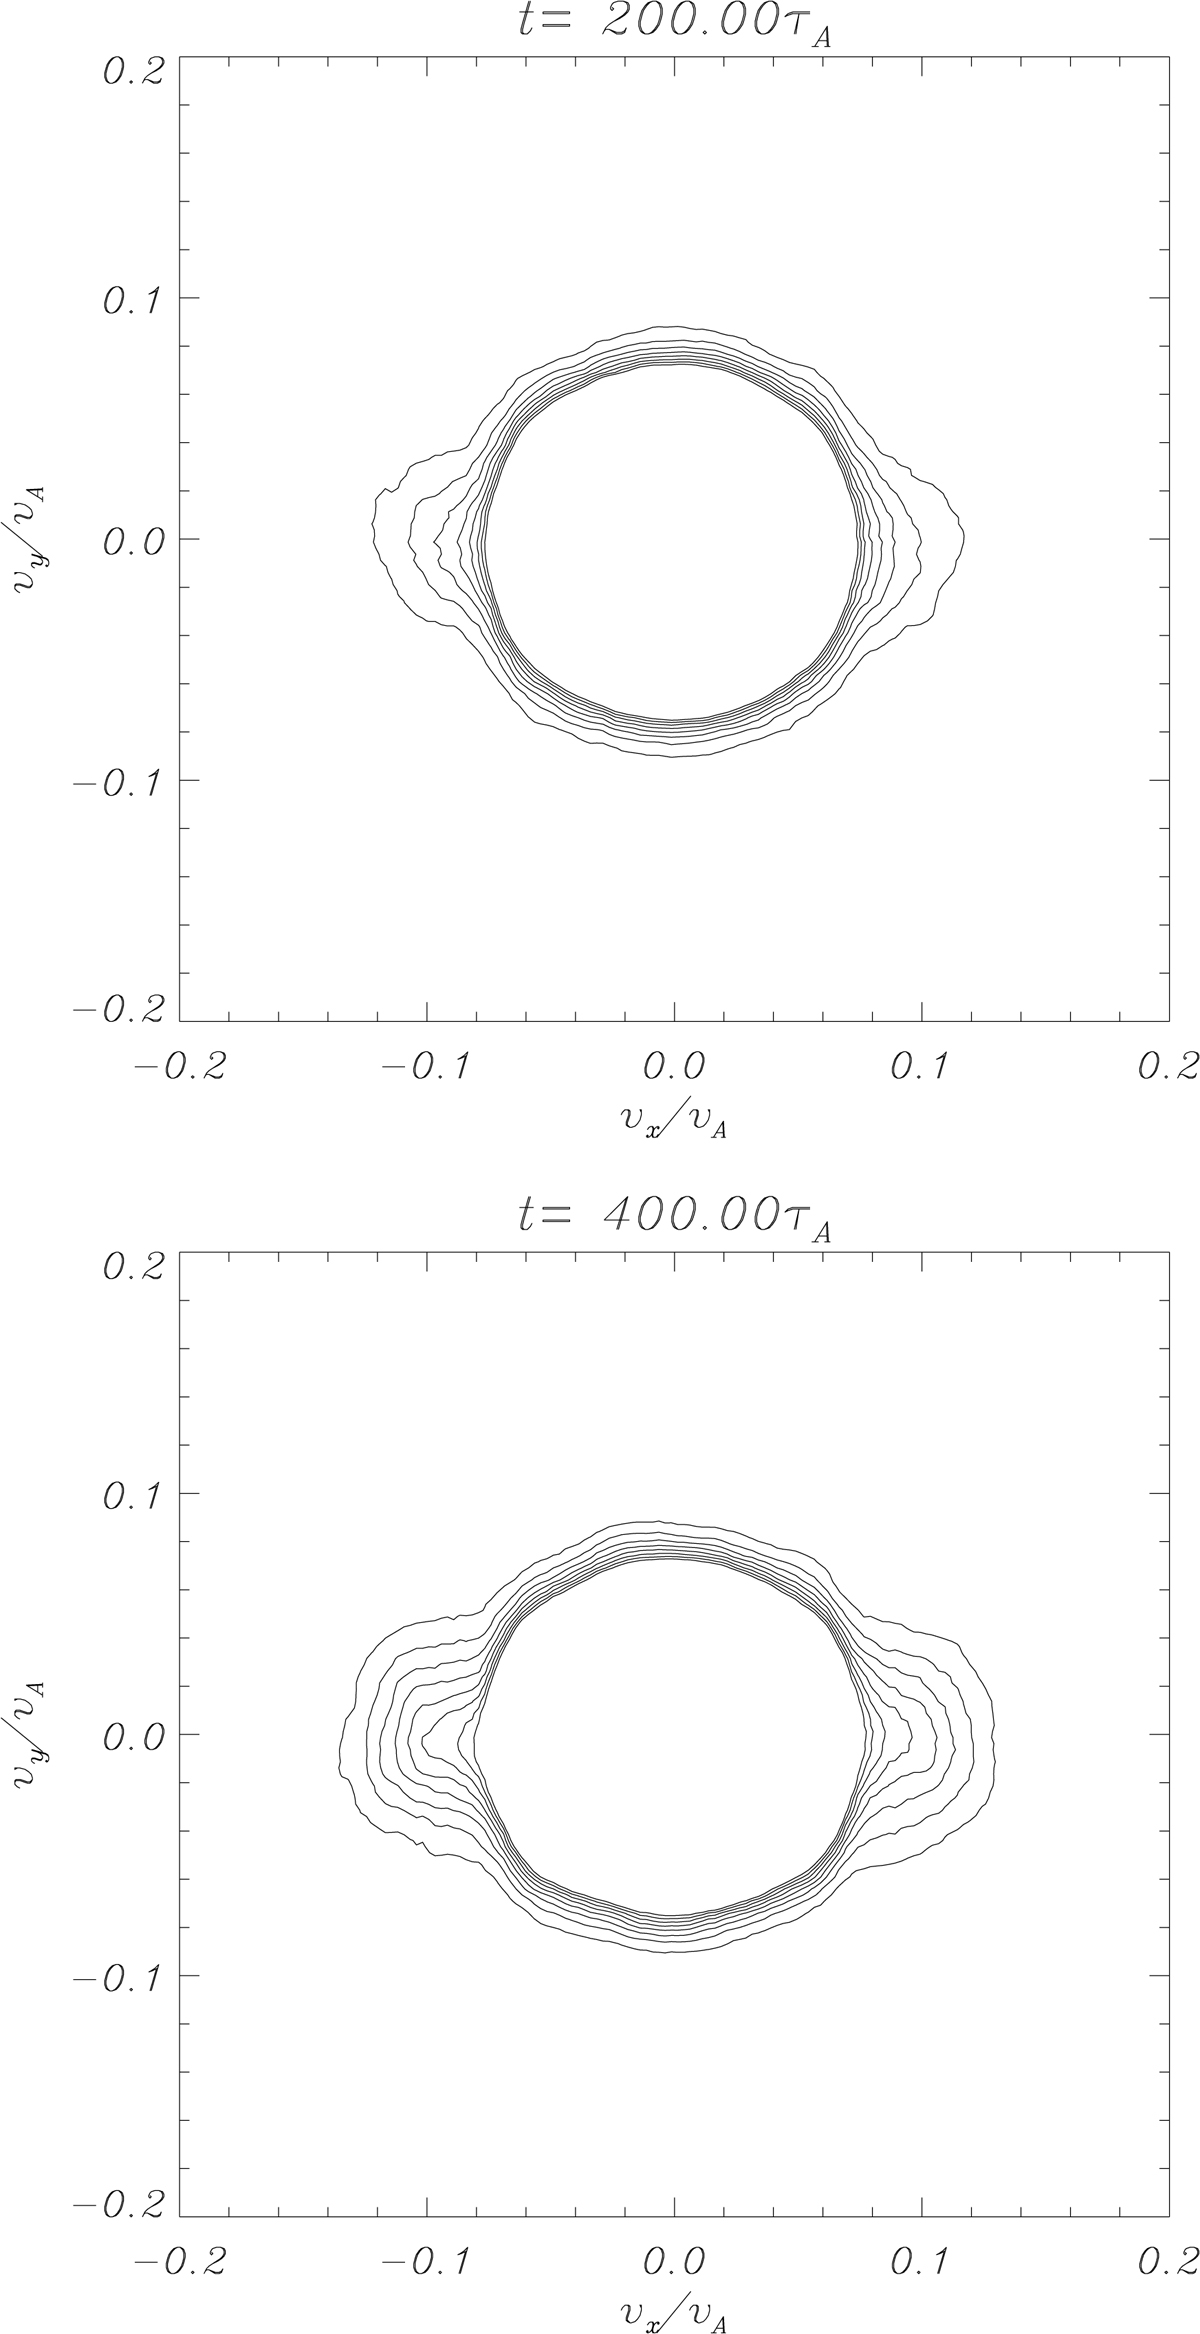
Fig. 5.
Download original image
Velocity distribution function as a function of vx and vy averaged over x and calculated from the 1D hybrid simulations at two different times of the evolution. Top panel: initial development of the beams due to LD. Bottom panel: later development of the beams. A logarithmic scale is used to represent the distribution function for a better visualisation of the results. In this plot βe = 6 × 10⁻² and βp = 10−3 and corresponds to weak LD.
Current usage metrics show cumulative count of Article Views (full-text article views including HTML views, PDF and ePub downloads, according to the available data) and Abstracts Views on Vision4Press platform.
Data correspond to usage on the plateform after 2015. The current usage metrics is available 48-96 hours after online publication and is updated daily on week days.
Initial download of the metrics may take a while.