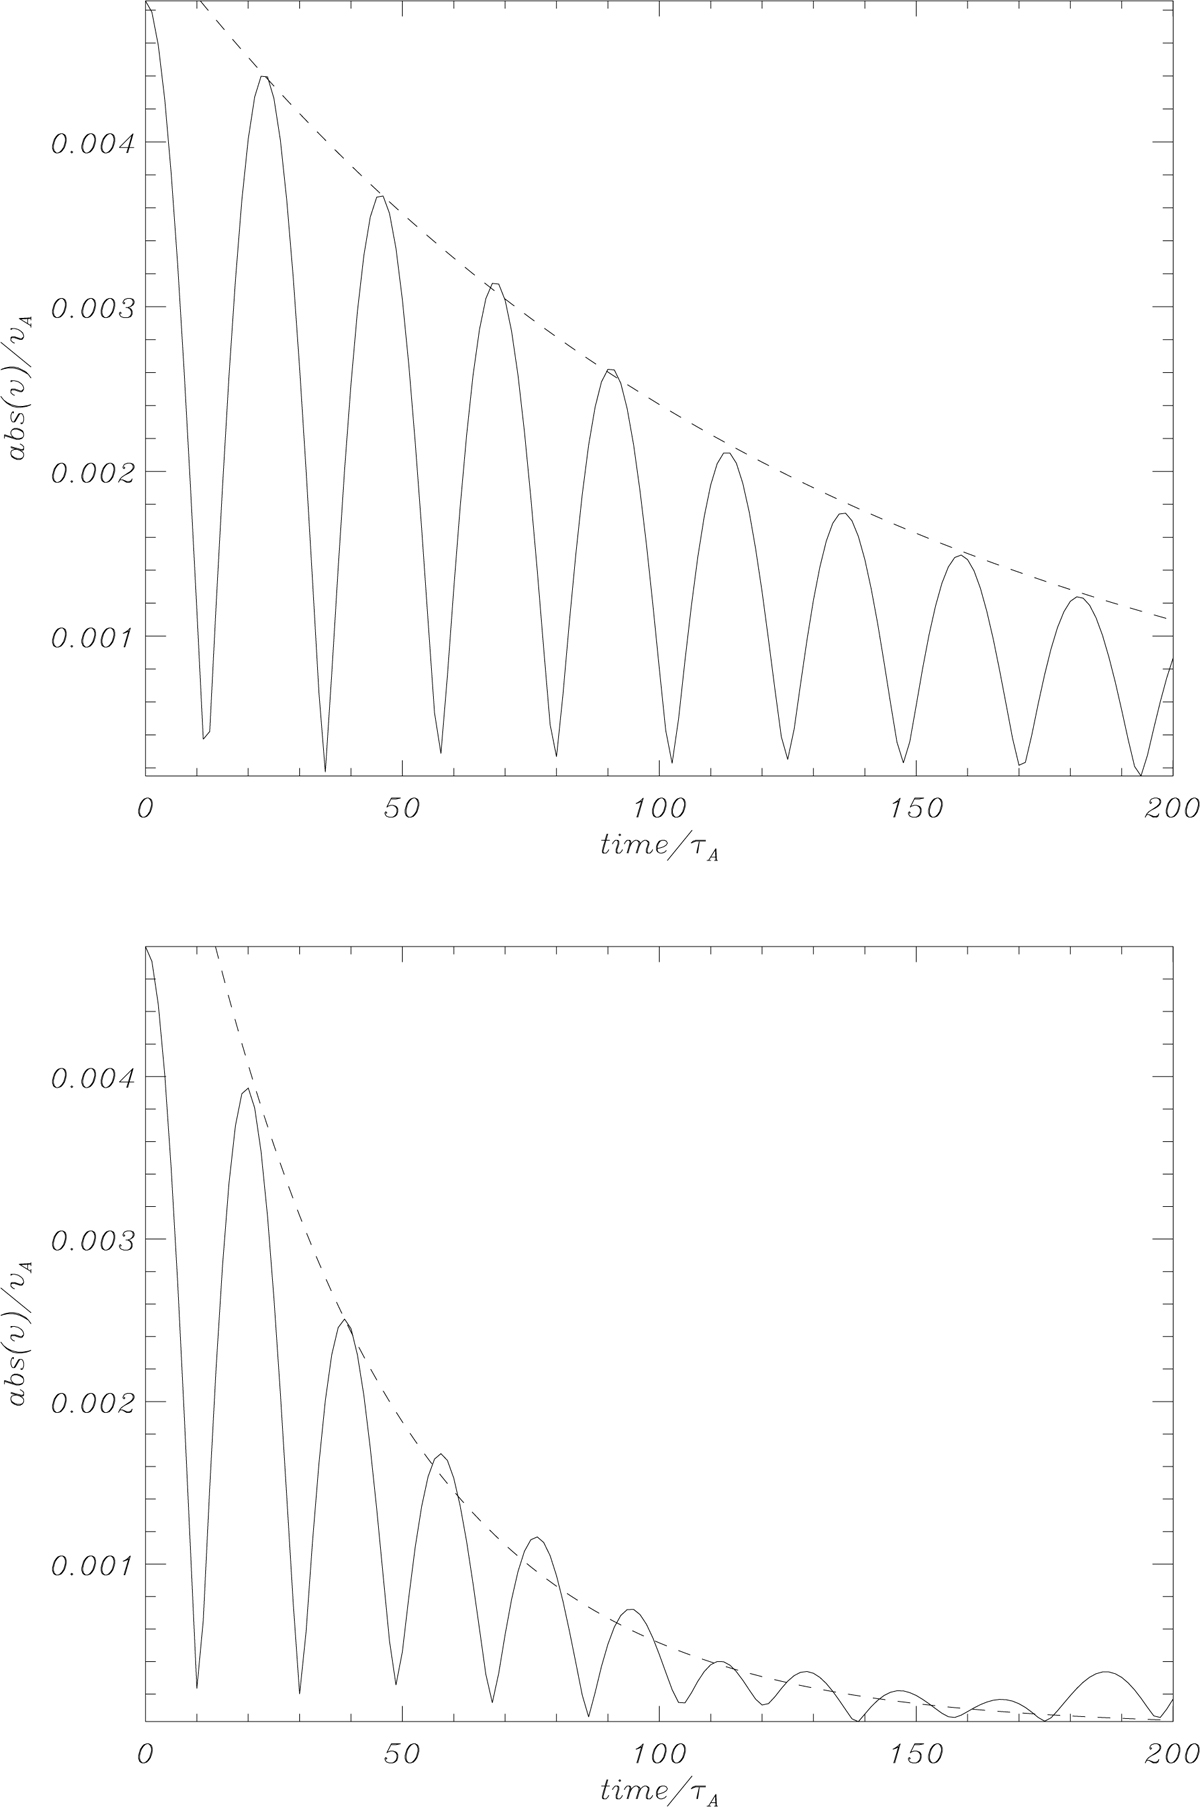
Fig. 2.
Download original image
Time evolution from the simulations. Top panel: absolute value of the coefficient of the Fourier velocity (macroscopic ux) inferred from the hybrid simulations corresponding to the excited wavelength in the system (m = 4 or equivalently m′ = 2). The dashed line represents the expected damping from the theoretical calculations based on the solution of the dispersion relation given by Eq. (19). In this plot βe = 6 × 10⁻² and βp = 10−2. Bottom panel: same as the top panel, but in this case βp = 2 × 10⁻², and therefore the attenuation is stronger.
Current usage metrics show cumulative count of Article Views (full-text article views including HTML views, PDF and ePub downloads, according to the available data) and Abstracts Views on Vision4Press platform.
Data correspond to usage on the plateform after 2015. The current usage metrics is available 48-96 hours after online publication and is updated daily on week days.
Initial download of the metrics may take a while.