Fig. 7.
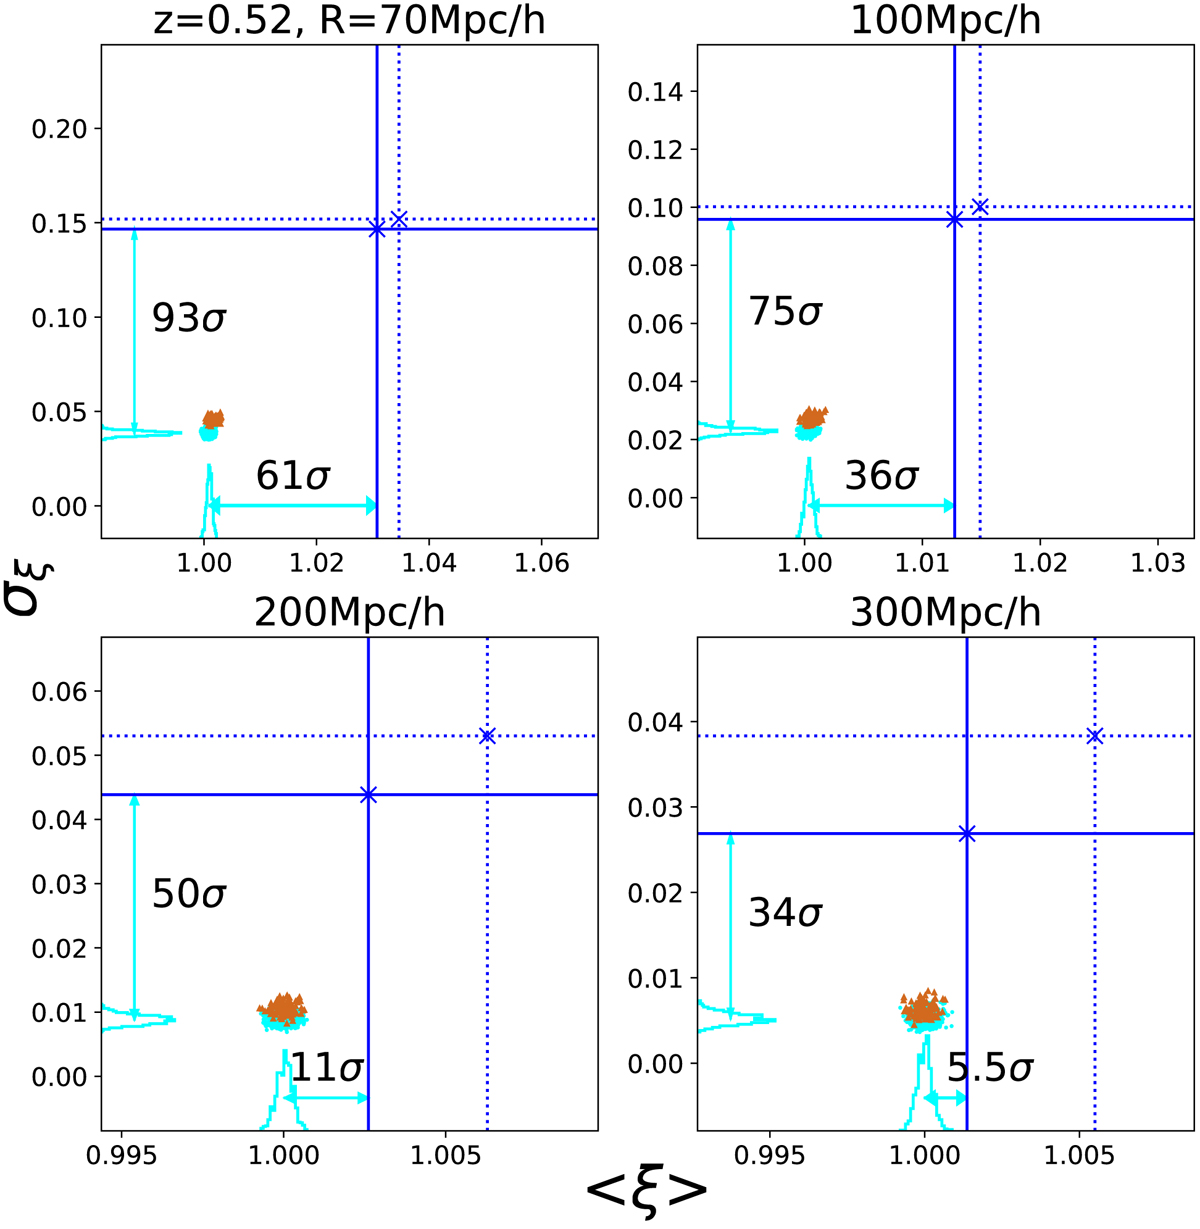
Download original image
Mean and standard deviation diagrams of the unmodified CMASS sample (blue markers and solid lines) and the corresponding 1000 random catalogs (cyan dots and histograms) for four different radii at the central redshift zcen = 0.52. Results of the magnitude-limited CMASS sample (faint blue markers and dotted lines) and the corresponding 108 random catalogs (brown markers) are also shown for comparison. The deviations of the CMASS sample from the 1000 random data are indicated in units of standard deviation (σ).
Current usage metrics show cumulative count of Article Views (full-text article views including HTML views, PDF and ePub downloads, according to the available data) and Abstracts Views on Vision4Press platform.
Data correspond to usage on the plateform after 2015. The current usage metrics is available 48-96 hours after online publication and is updated daily on week days.
Initial download of the metrics may take a while.