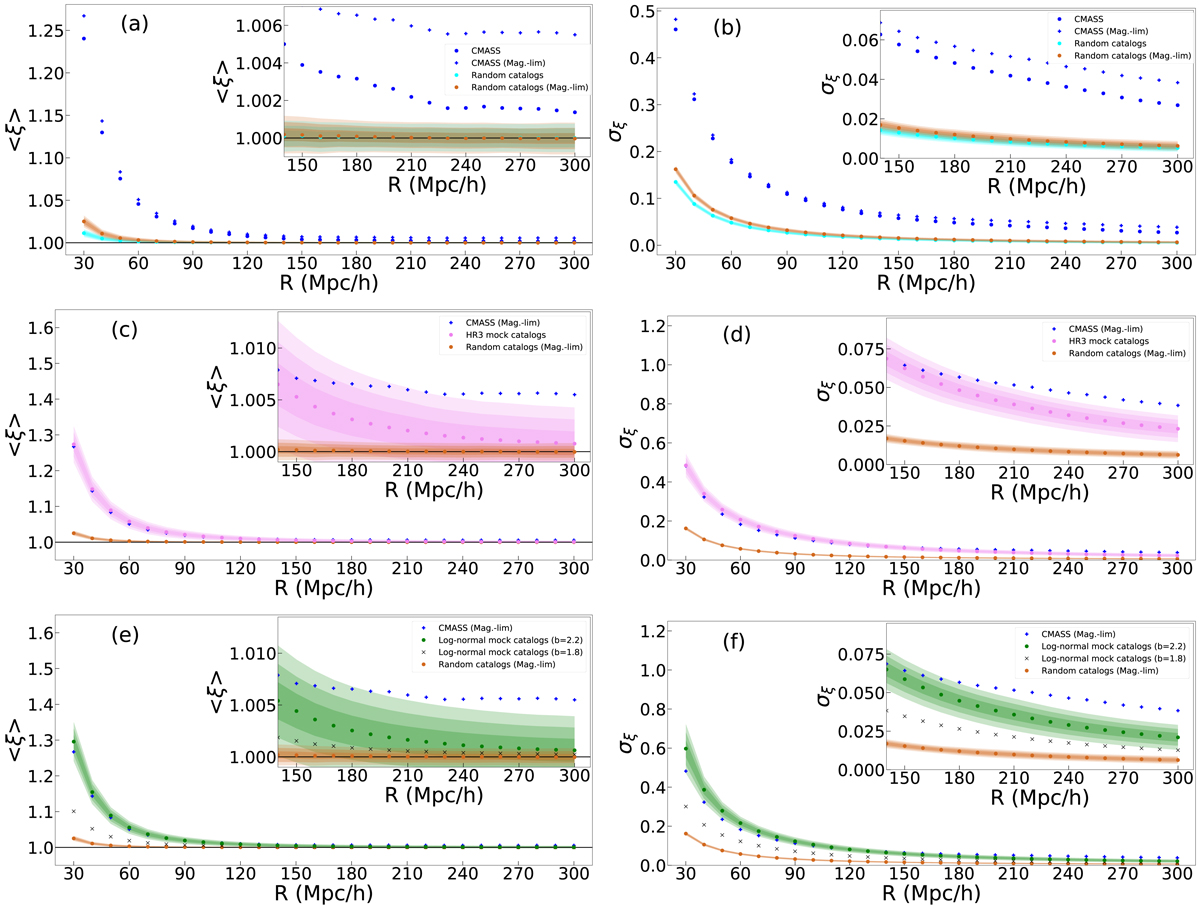
Fig. 6.
Download original image
Mean (⟨ξ⟩) and standard deviation (σξ) of ξ as a function of radius (R). The top panels (a,b) show the results of the unmodified CMASS sample (blue dots) and the corresponding 1000 random catalogs (cyan dots), together with those of the magnitude-limited CMASS sample (blue plus signs) and the corresponding 1000 random catalogs (brown dots). The results of the 108 HR3 mock catalogs (pink dots) are shown in the middle panels (c,d), together with those of the magnitude-limited CMASS sample and the corresponding random catalogs. The bottom panels (e,f) present the results of the log-normal mock catalogs generated with a bias factor b = 2.2 (green dots). For a comparison, the results for b = 1.8 are shown as cross marks (×s). The shaded regions in each panel, in order from dark to light, represent 1, 2, and 3 sigma confidence regions, which have been estimated from measured means and standard deviations of individual random or mock catalogs. The information of the shaded regions between the specified radius scales are interpolated.
Current usage metrics show cumulative count of Article Views (full-text article views including HTML views, PDF and ePub downloads, according to the available data) and Abstracts Views on Vision4Press platform.
Data correspond to usage on the plateform after 2015. The current usage metrics is available 48-96 hours after online publication and is updated daily on week days.
Initial download of the metrics may take a while.