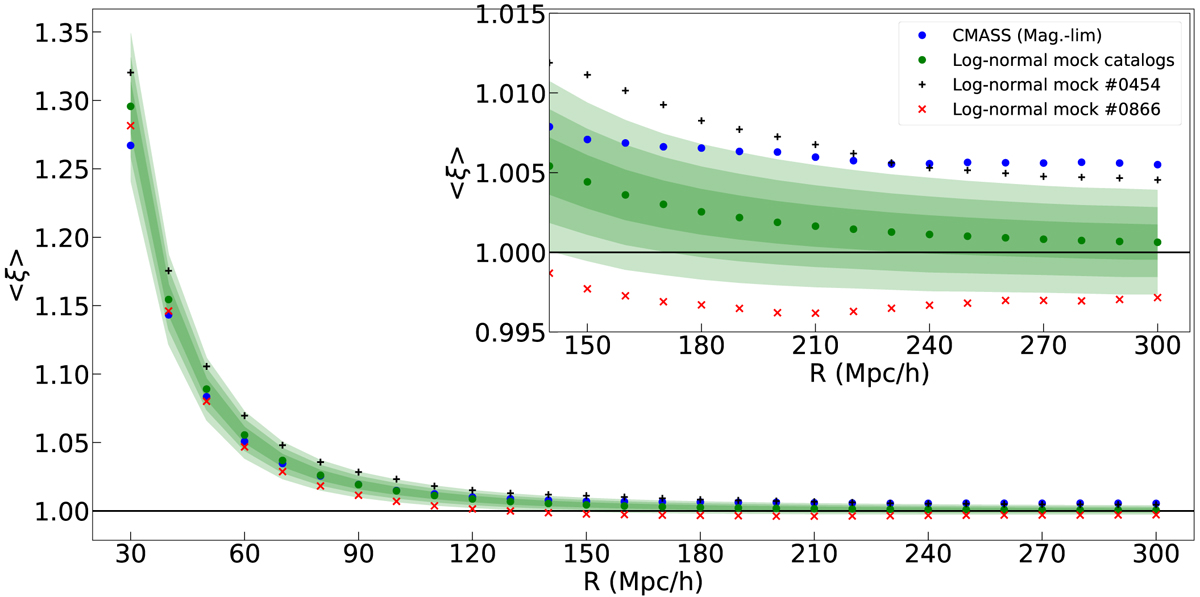
Fig. 10.
Download original image
Variation of ⟨ξ⟩ as a function of radius R for log-normal mock catalogs (green dots with shaded regions) and the magnitude-limited CMASS sample (blue dots), which is the same as in Fig. 6e. Here the cases of the maximum (black plus signs) and the minimum (red cross marks) ⟨ξ⟩ at 300 h−1 Mpc among the 1000 log-normal mock catalogs have been added.
Current usage metrics show cumulative count of Article Views (full-text article views including HTML views, PDF and ePub downloads, according to the available data) and Abstracts Views on Vision4Press platform.
Data correspond to usage on the plateform after 2015. The current usage metrics is available 48-96 hours after online publication and is updated daily on week days.
Initial download of the metrics may take a while.