Fig. 9
Download original image
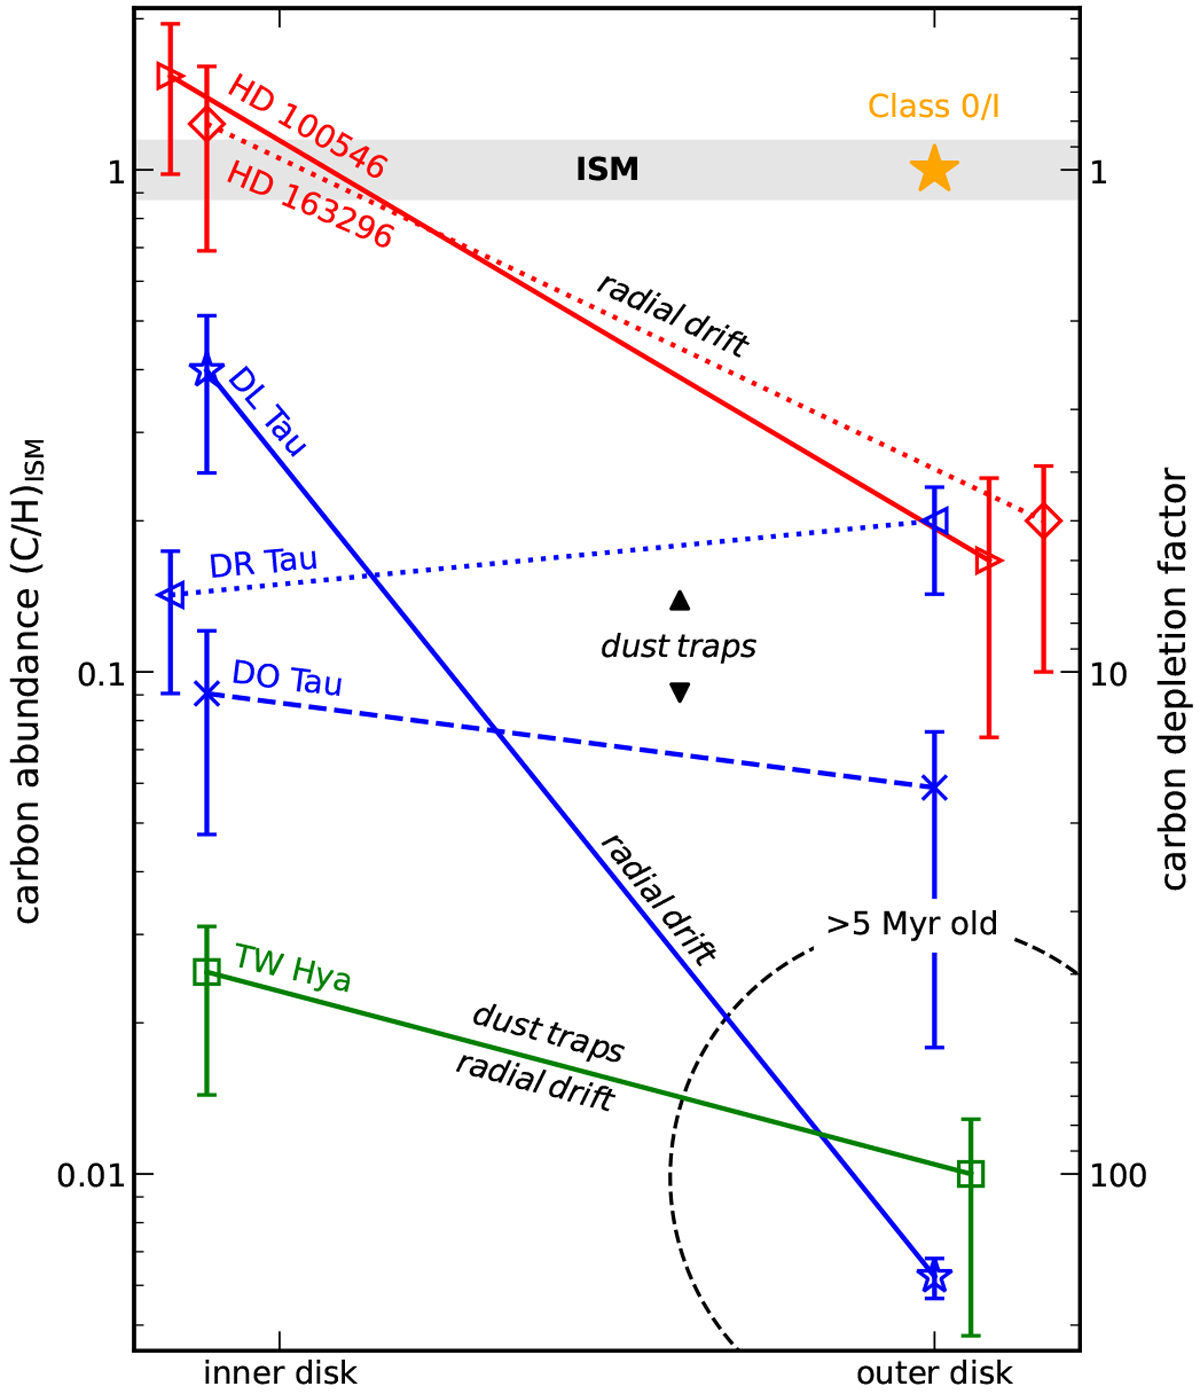
Radial profile of the volatile carbon depletion fraction based on one point inside the dust sublimation rim and a disk-averaged carbon abundance in the outer disk. The outer depletion fractions of the sources in blue are from this work. Inner disk carbon abundances of these three sources are taken from McClure (2019). We added TW Hya in green (Zhang et al. 2019; Kama et al. 2016b; McClure et al. 2020) and one point in the outer disk for ten Class 0/I sources in yellow (Harsono et al. 2014; Zhang et al. 2020b; Bergner et al. 2020) to illustrate the increase in the level of carbon depletion during the system’s evolution. Two Herbig Ae/Be stars, HD 163296 (Kama et al. 2015; Zhang et al. 2019) and HD 100546 (Kama et al. 2015, 2016b), are shown in red to complete the picture of carbon depletion that we have. These sources do not follow the evolutionary trend, because they are much warmer.
Current usage metrics show cumulative count of Article Views (full-text article views including HTML views, PDF and ePub downloads, according to the available data) and Abstracts Views on Vision4Press platform.
Data correspond to usage on the plateform after 2015. The current usage metrics is available 48-96 hours after online publication and is updated daily on week days.
Initial download of the metrics may take a while.