Fig. 8
Download original image
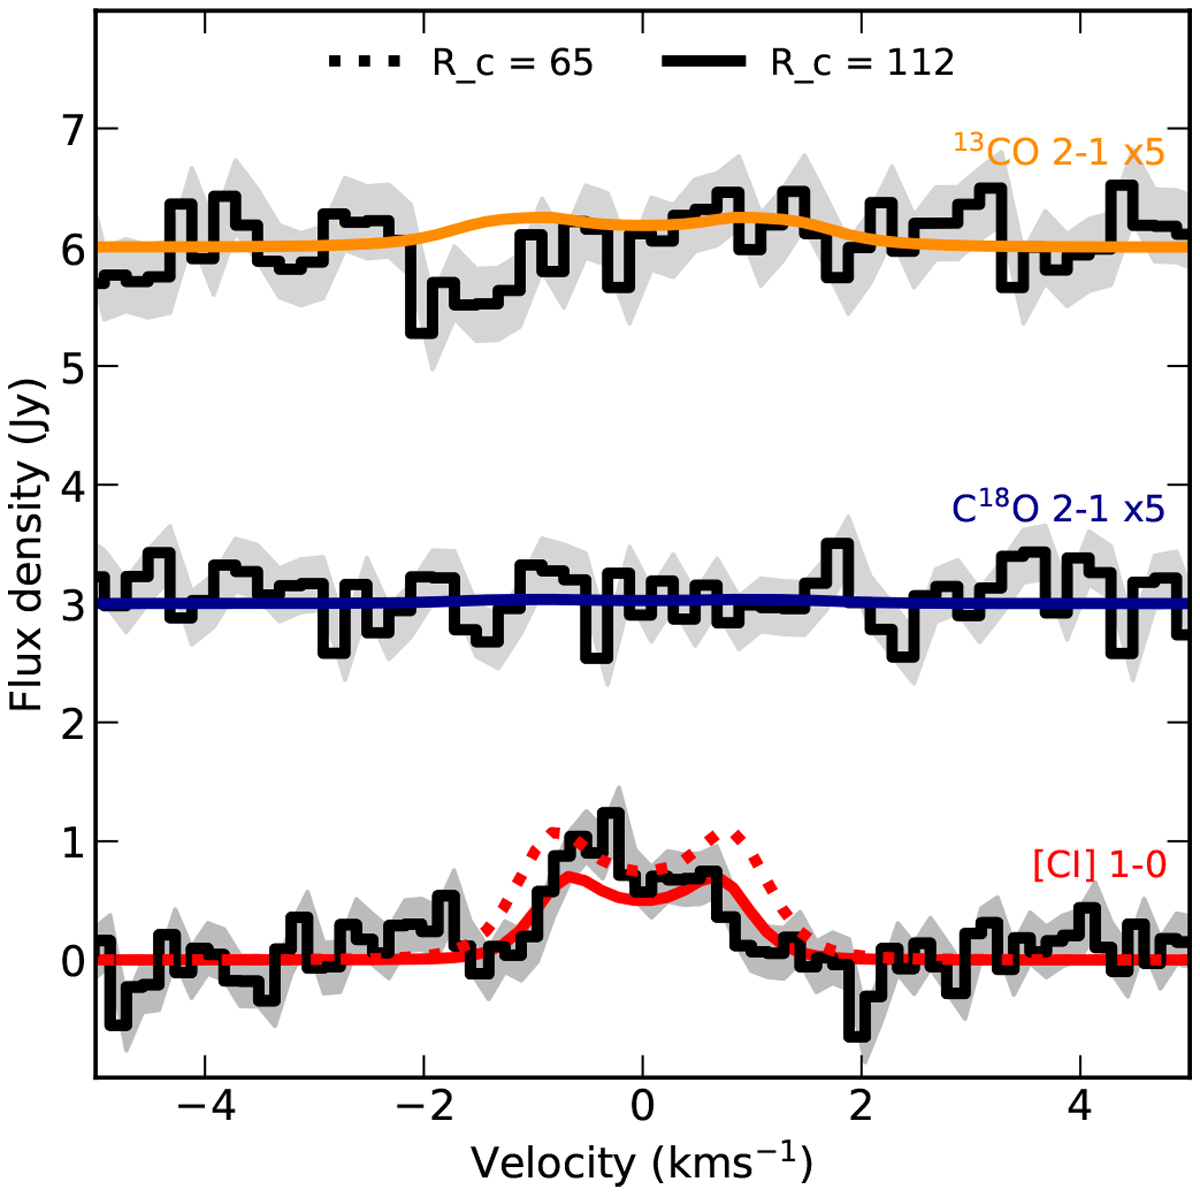
Observations and modeling of DL Tau. Two models are plotted: the solid line is a model with Rc = 112 AU as observed in the dust and the dashed line as a model with Rc = 65, which fits the spatially resolved [C I] emission best. Further details can be found in the main text. 1σ error bars are indicated in gray for each spectrum. The data and models of the weak CO isotopologue J = 2−1 transitions have been multiplied by a factor of 5 for illustrative purposes.
Current usage metrics show cumulative count of Article Views (full-text article views including HTML views, PDF and ePub downloads, according to the available data) and Abstracts Views on Vision4Press platform.
Data correspond to usage on the plateform after 2015. The current usage metrics is available 48-96 hours after online publication and is updated daily on week days.
Initial download of the metrics may take a while.