Free Access
Fig. 6
Download original image
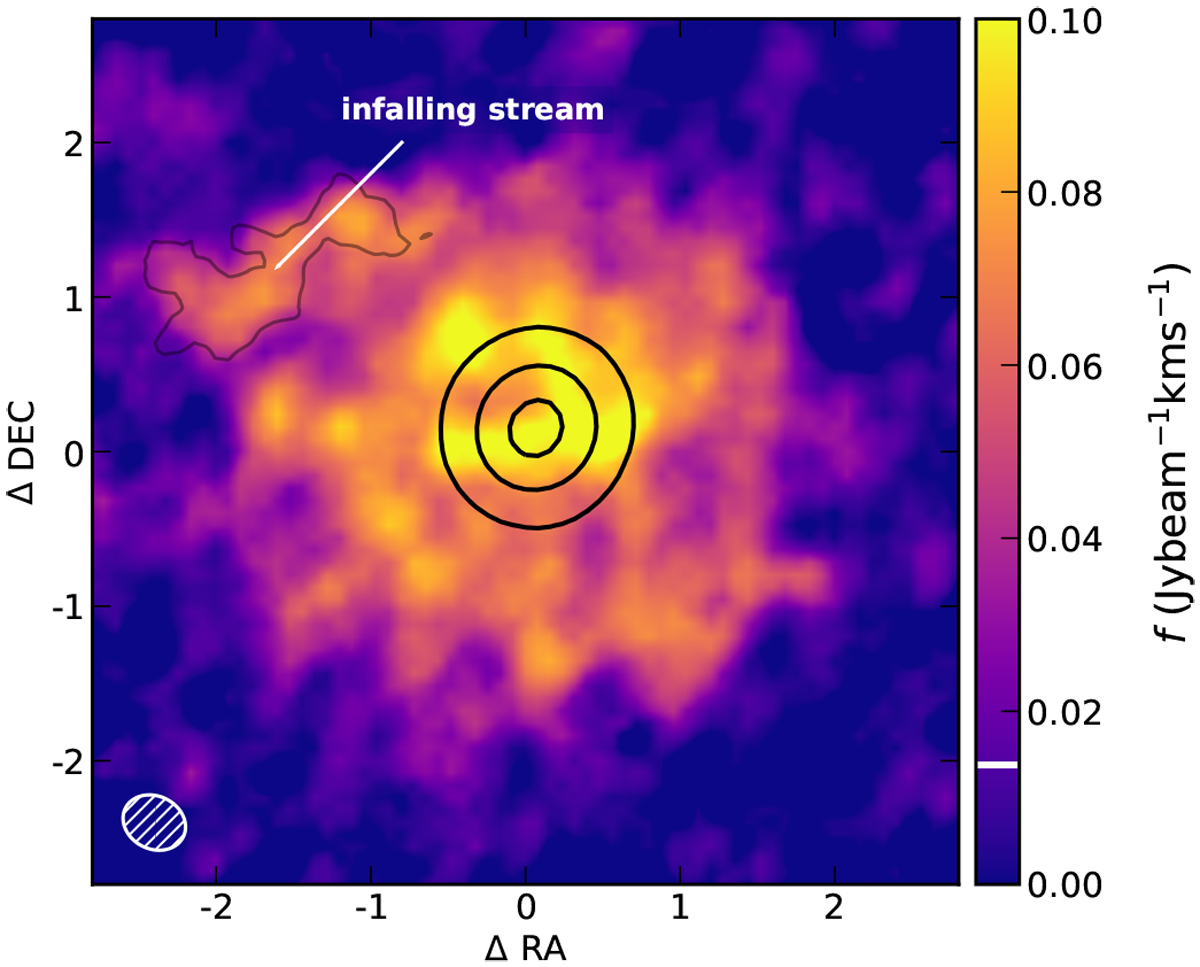
Total intensity or moment zero map of the 13CO J = 3−2 emission in DR Tau. The black contours show the continuum emission at 0.8 mm. The gray contours show the residuals after subtracting an azimuthally averaged radial disk profile to highlight the infalling stream. The beam size is shown in the lower-left corner.
Current usage metrics show cumulative count of Article Views (full-text article views including HTML views, PDF and ePub downloads, according to the available data) and Abstracts Views on Vision4Press platform.
Data correspond to usage on the plateform after 2015. The current usage metrics is available 48-96 hours after online publication and is updated daily on week days.
Initial download of the metrics may take a while.