Free Access
Fig. 3
Download original image
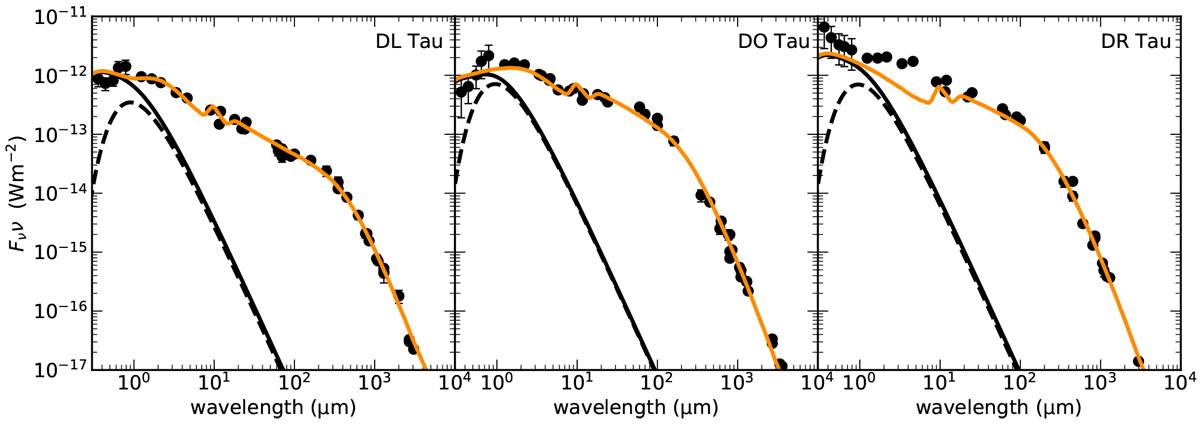
SEDs of the three modeled sources with our model fit in orange. The black dots with error bars represent observations, the dashed black curve denotes the stellar component, and the solid black curve is a combination of the stellar component and the ultraviolet excess due to accreting material as used in the modeling.
Current usage metrics show cumulative count of Article Views (full-text article views including HTML views, PDF and ePub downloads, according to the available data) and Abstracts Views on Vision4Press platform.
Data correspond to usage on the plateform after 2015. The current usage metrics is available 48-96 hours after online publication and is updated daily on week days.
Initial download of the metrics may take a while.