Fig. C.1
Download original image
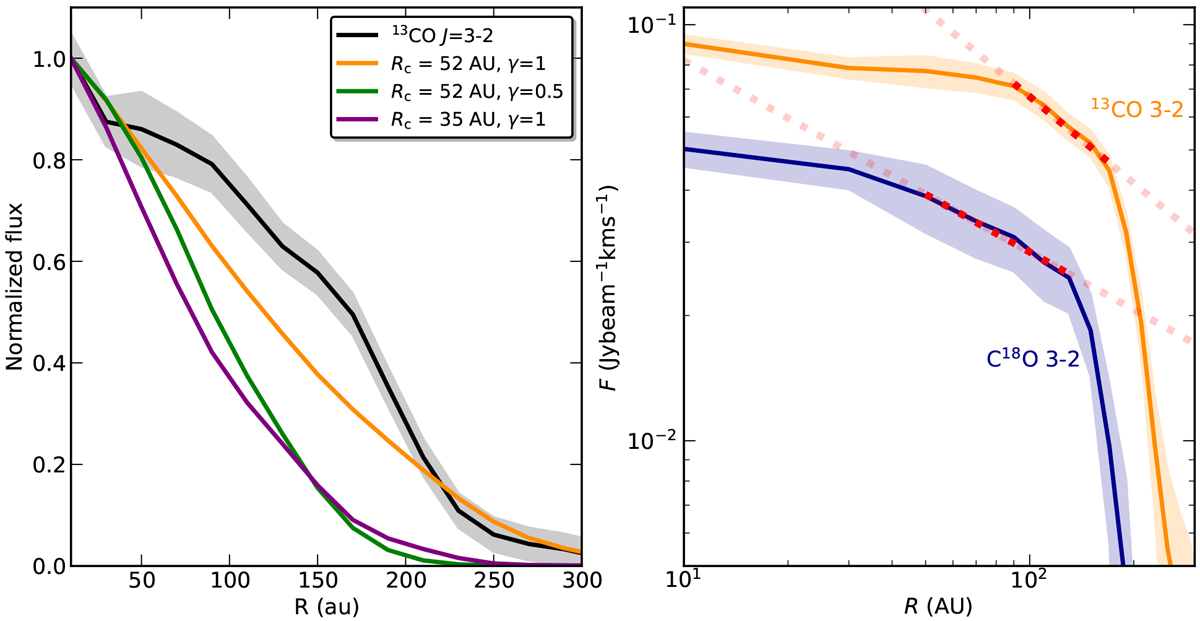
Left: Radial profile of the 13CO data (in black) with three models that vary Rc and γ, that are convolved with a Gaussian beam similar to the observations. Parameters that are changed with respect to the fiducial model used in the main text are denoted in the legend. The shaded region marks the 1σ uncertainty on the azimuthal average of the data. Right: Radial profile of the 13CO (orange) and C18O emission (blue) in DR Tau. The dotted lines are a linear fit in log-log space. The fit is only performed in the pivot region (bold dotted line), where the line is optically thin but with enough column density to efficiently self-shield. The shaded regions mark the 1σ uncertainty on the azimuthal average of the data.
Current usage metrics show cumulative count of Article Views (full-text article views including HTML views, PDF and ePub downloads, according to the available data) and Abstracts Views on Vision4Press platform.
Data correspond to usage on the plateform after 2015. The current usage metrics is available 48-96 hours after online publication and is updated daily on week days.
Initial download of the metrics may take a while.