Fig. 1
Download original image
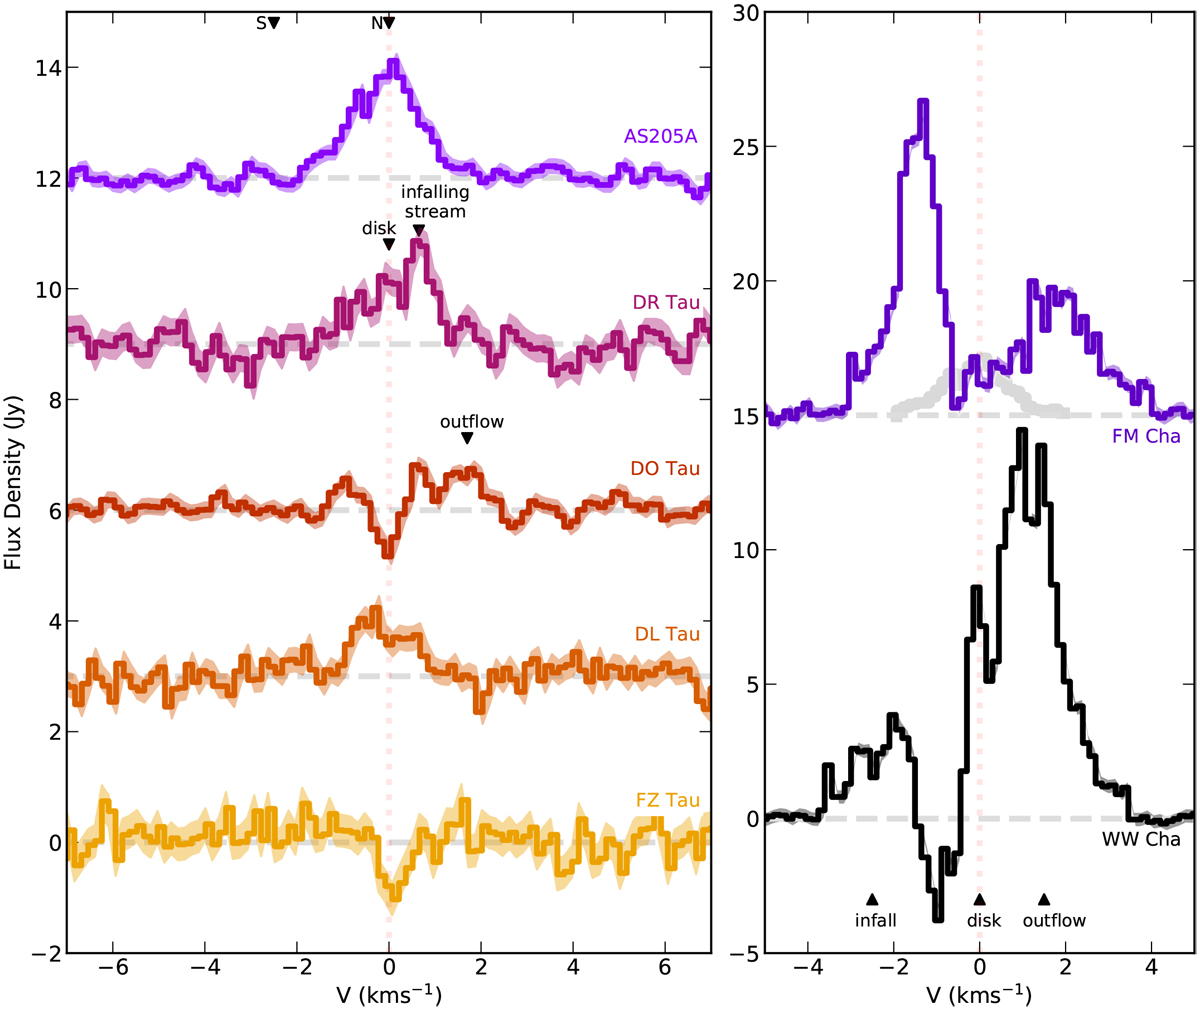
Spatially integrated emission spectra of the [C I] J = 1−0 line at 492.165 GHz for the seven sources in our sample. All the spectra are shifted to their respective local standard of rest velocity (Table 1). The shaded region marks the 1σ uncertainty for each source. The spectrum of AS 205 A is shown in gray with FM Cha as a reference of the typical linewidth for a modestly inclined disk. “N” and “S” depict the Vlsr of AS 205 Ν and AS 205 S, respectively.
Current usage metrics show cumulative count of Article Views (full-text article views including HTML views, PDF and ePub downloads, according to the available data) and Abstracts Views on Vision4Press platform.
Data correspond to usage on the plateform after 2015. The current usage metrics is available 48-96 hours after online publication and is updated daily on week days.
Initial download of the metrics may take a while.