Fig. 4.
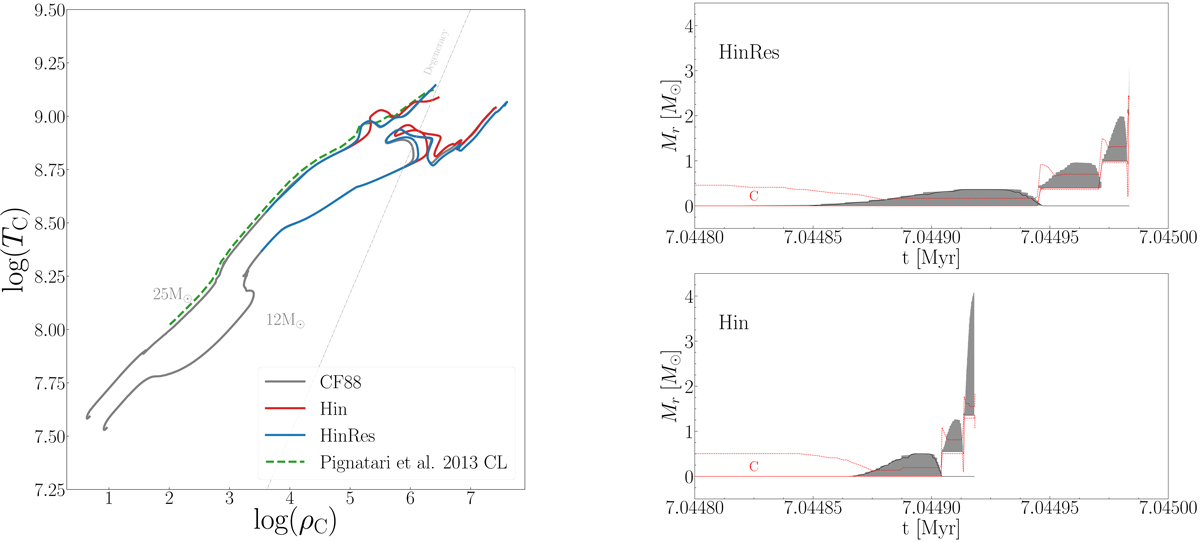
Download original image
Evolution of central temperature as a function of central density for 12 M⊙ and 25 M⊙ models with different 12C + 12C reaction rates (left panel). Kippenhahn diagrams for the centre of 25 M⊙ models during the end of C-burning phase with Hin and HinRes 12C + 12C reaction rates (right panel). The grey shaded area shows the convective zones. The red dashed line show the limits of the C-burning zones (defined where ϵC ≥ 102 erg g−1 s−1).
Current usage metrics show cumulative count of Article Views (full-text article views including HTML views, PDF and ePub downloads, according to the available data) and Abstracts Views on Vision4Press platform.
Data correspond to usage on the plateform after 2015. The current usage metrics is available 48-96 hours after online publication and is updated daily on week days.
Initial download of the metrics may take a while.