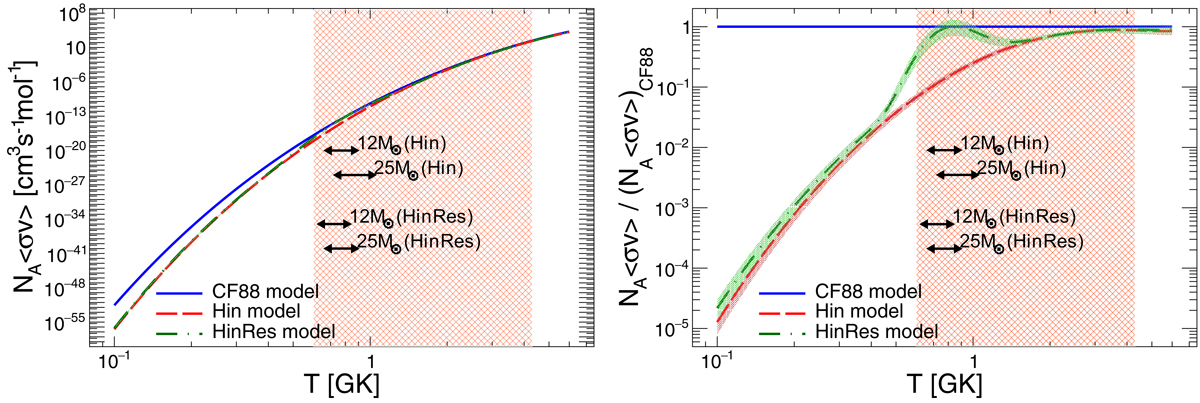
Fig. 2.
Download original image
Reaction rates (left) and normalized reaction rates to NA⟨σv⟩)CF88 (right), without (Hin; red curve) and with (HinRes; green curve) the added resonance. The reaction rate from the CF88 model is also presented (blue curve). The shaded areas around the curves are the uncertainties (see text). Orange hatched areas show the temperature region explored by the STELLA experiment. The black arrows show the regions where carbon fusion occurs, for two stellar models (12 and 25 M⊙), for both the Hin and HinRes models (see Sect. 4 and Fig. 3).
Current usage metrics show cumulative count of Article Views (full-text article views including HTML views, PDF and ePub downloads, according to the available data) and Abstracts Views on Vision4Press platform.
Data correspond to usage on the plateform after 2015. The current usage metrics is available 48-96 hours after online publication and is updated daily on week days.
Initial download of the metrics may take a while.