Free Access
Fig. 8
Download original image
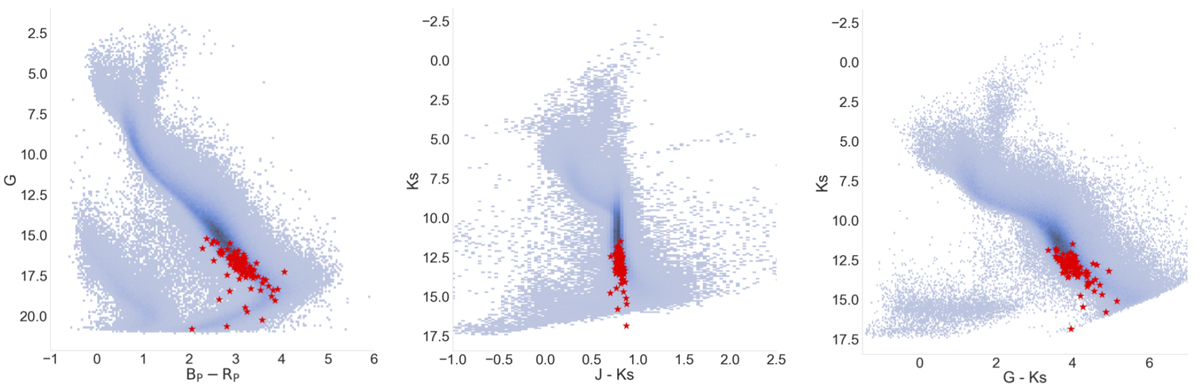
Proper motion diagram for the 99 sources detected in the VVVX footprint (red stars) with respect to the proper motions in right ascension and declination coordinates of nearby objects within 30′′ (blue dots).
Current usage metrics show cumulative count of Article Views (full-text article views including HTML views, PDF and ePub downloads, according to the available data) and Abstracts Views on Vision4Press platform.
Data correspond to usage on the plateform after 2015. The current usage metrics is available 48-96 hours after online publication and is updated daily on week days.
Initial download of the metrics may take a while.